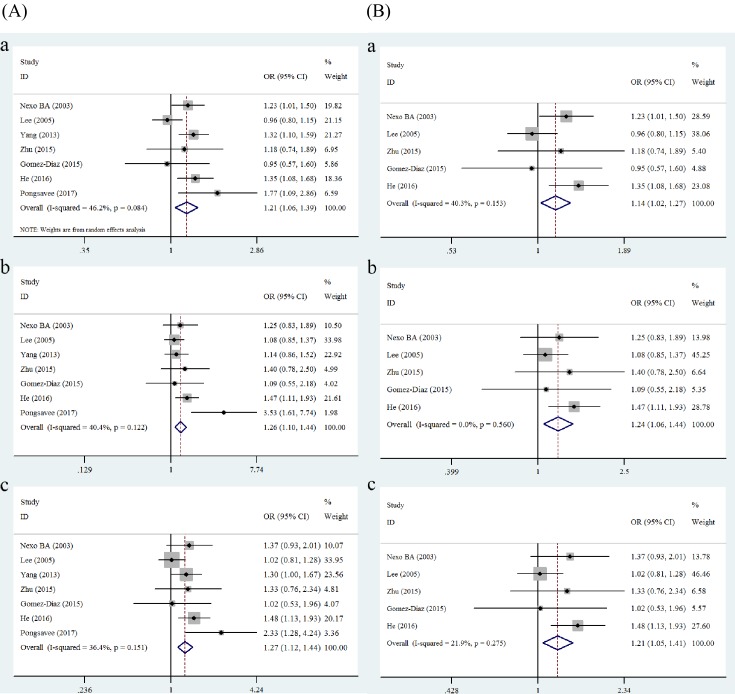
Figure 2. Forest plots of breast cancer risk associated with ERCC1 rs11615.
The plots were grouped into (A) and (B) for comparison. (A) All studies: (a) allele model (T compared with C); (b) heterozygous model (TC compared with CC); (c) dominant model (TC + TT compared with CC). (B) After excluding the studies that deviated from HWE: (a) allele model (T compared with C); (b) heterozygous model (TC compared with CC); (c) dominant model (TC + TT compared with CC).

