Figure 3.
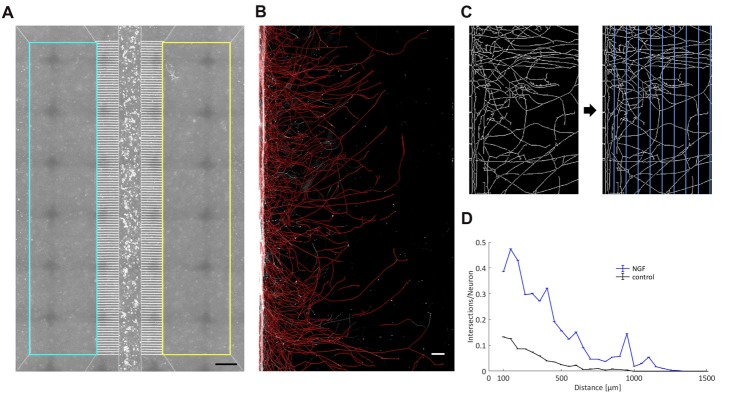
A linear Sholl analysis tool. (A) By employing the chamber’s phase contrast image, two rectangles comprising the two axonal compartments have been defined as region of interest (ROI) within which the fluorescence signal of the axonal processes was analyzed. Scale bar is 500 μm. (B) A detailed view into an axonal compartment. Binarized and skeletonized processes are shown in red and are superimposed on the original black-and-white fluorescent image. Scale bar is 100 μm. (C) Magnification of skeletonized axons. Vertical grid lines with a spacing of 50 μm were laid upon the skeletonized axons. The number of axonal intersections was determined for each line. (D) Readout of a single experiment with the two curves representing the two axonal compartments. The number of intersections was normalized by the total number of neurons in the main channel and plotted against the width of an axonal compartment. “0” denotes the exit from the microgrooves.

