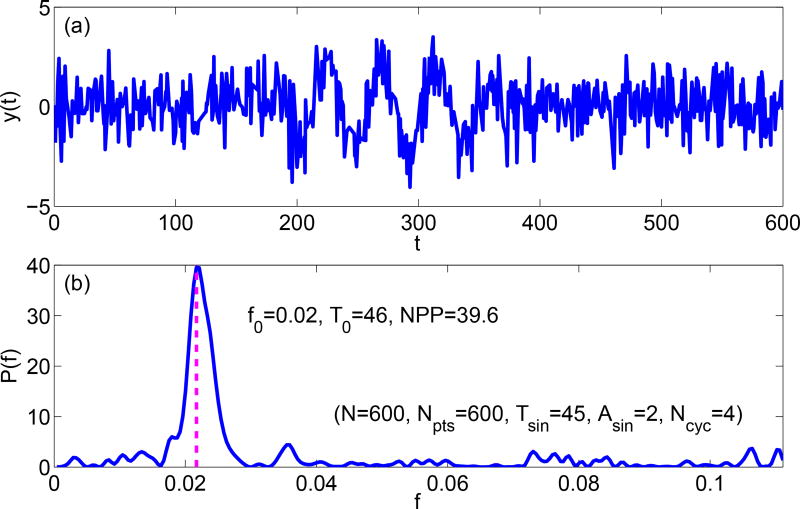
Figure A1.
Example Lomb-Scargle periodogram analysis: (a) A simulated signal with length of 600 points, wave period of 45 points, wave amplitude of 2, and 4 sinusoidal cycles; (b) Lomb-Scargle periodogram of the simulated signal. The magenta dashed line indicates the NPP is 37.6, the wave frequency is 0.02, and the wave period is 46.

