. 2016 Mar 10;7(6):3919–3927. doi: 10.1039/c5sc04272k

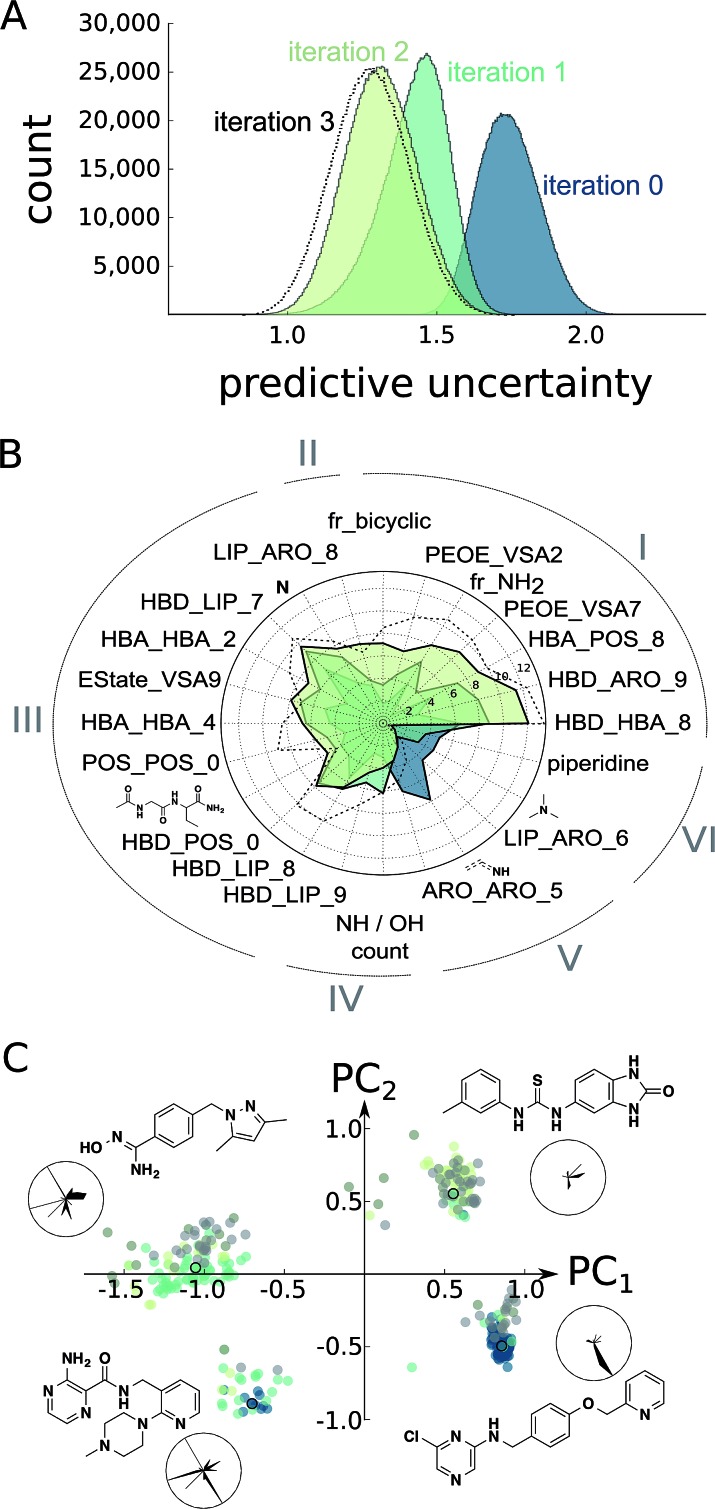
Fig. 3. Estimation of model improvement and architecture change after the prospective active learning iterations. (A) Difference in predictive uncertainty (standard deviation of predictions of trees)23 for the Enamine screening collection30 using the random forest models. The individual random forest models were trained on the ChEMBL19 data (“iteration 0”),28 the ChEMBL19 data plus the first active learning iteration results (“iteration 1”), the ChEMBL19 data plus both active learning iteration results (“iteration 2”), or the ChEMBL19 data plus both learning and the exploitive and hit-expansion iterations (“iteration 3”). (B) Change in random forest feature importance25 for the top features of the models “iteration 0”, “iteration 1” and “iteration 2”. We can clearly observe the development of different classes of feature importance. For example, many features became consistently more or less important during learning (I and VI), while others seem to have converged after the first learning iteration (III and V). More interestingly, a few features have been only discovered (II) or have been disvalued (IV) during the second iteration. The importance values for the model “iteration 3” are shown for comparison. (C) Position of the top 100 predicted screening compounds from each model in feature space (colored dots). The feature space was generated as the first two principle components (PC1, PC2) of normalized features selected in (B). The cluster representatives (colored dots with black circles) are shown as chemical structures and their normalized feature values in radar charts. In these radar charts, the circle corresponds to the maximal feature values, and the black, filled areas correspond to the feature values for the respective chemical structure shown. The features are arranged as in (B).

Fig. 3