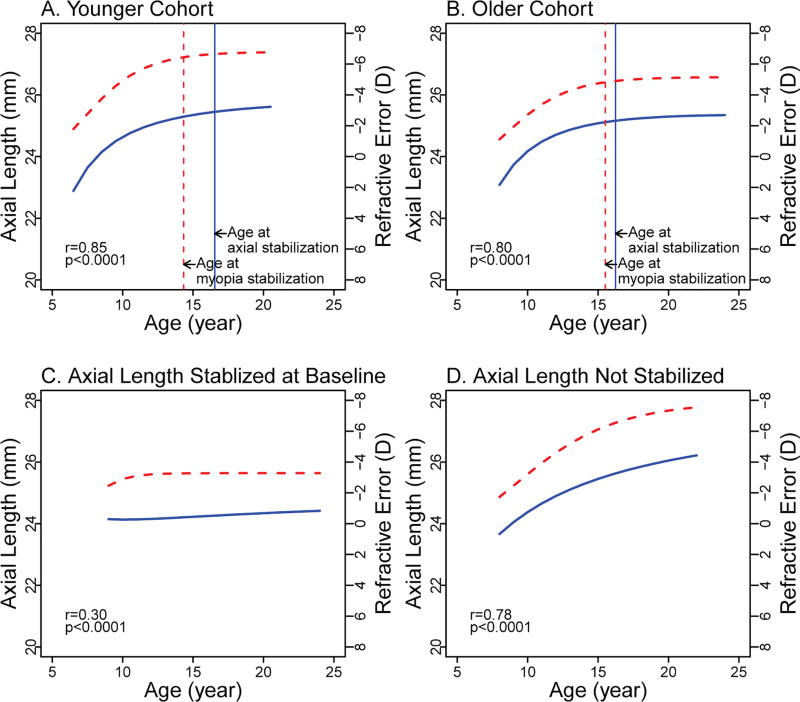
Figure 2.
Axial elongation and myopia progression by analysis cohort. Axial length curves are represented by blue solid curves and myopia progression curves are represented by red dashed curves. Vertical solid blue lines indicate the age of myopia stabilization; vertical dashed red lines indicate the age at myopia stabilization. r: semi-partial correlation between axial length and myopia curves based on linear mixed models. (A) Younger cohort: children with baseline age of 6-<8 years and axial elongation after baseline; (B) Older cohort: children with baseline age ≥8 years and axial elongation after baseline; (C) Axial Length Stabilized at Baseline cohort: the annual change rates of axial elongation at all visits < 0.06mm/year; (D) Axial Length Not Stabilized cohort: the annual change rates of axial elongation at all visits > 0.06mm/year.

