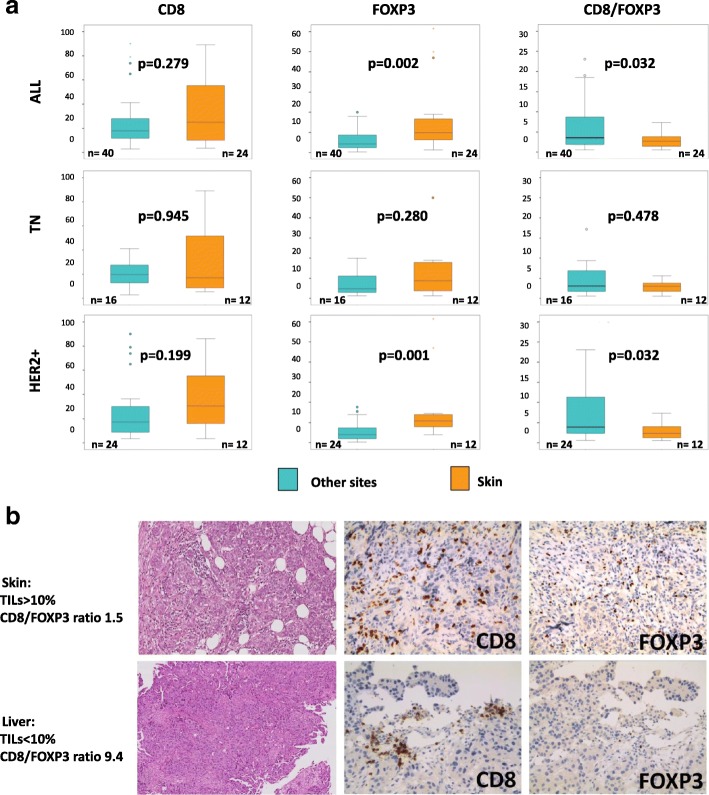
Fig. 2.
CD8, FOXP3, and CD8/FOXP3 ratio in skin versus other metastasis sites. Boxplots comparing CD8, FOXP3, and CD8/FOXP3 ratio in skin versus other metastasis sites in all patients and in TN and HER2+ cohorts separately (a). Pictures showing a skin metastasis with high TILs and low CD8/FOXP3 ratio and a liver metastasis with low TILs and high CD8/FOXP3 ratio (b). HER2 human epidermal growth factor receptor-2, TILs tumor-infiltrating lymphocytes, TN triple negative.

