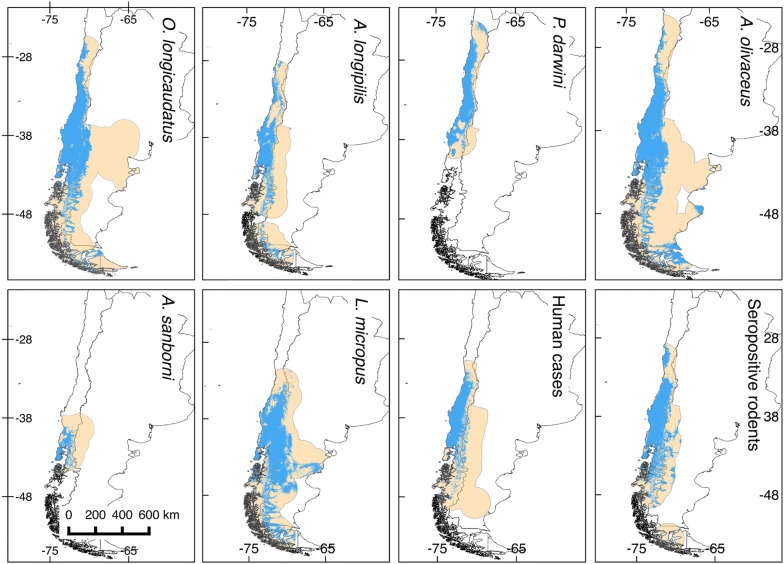
Fig. 1.
Ecological niche models for rodent hantavirus hosts, seropositive rodents, and human HPS cases. Orange areas depict potential distributions based on ecological niche models. Blue areas show the study area M for model calibration. These binary maps were generated based on an acceptable omission rate of 5%

