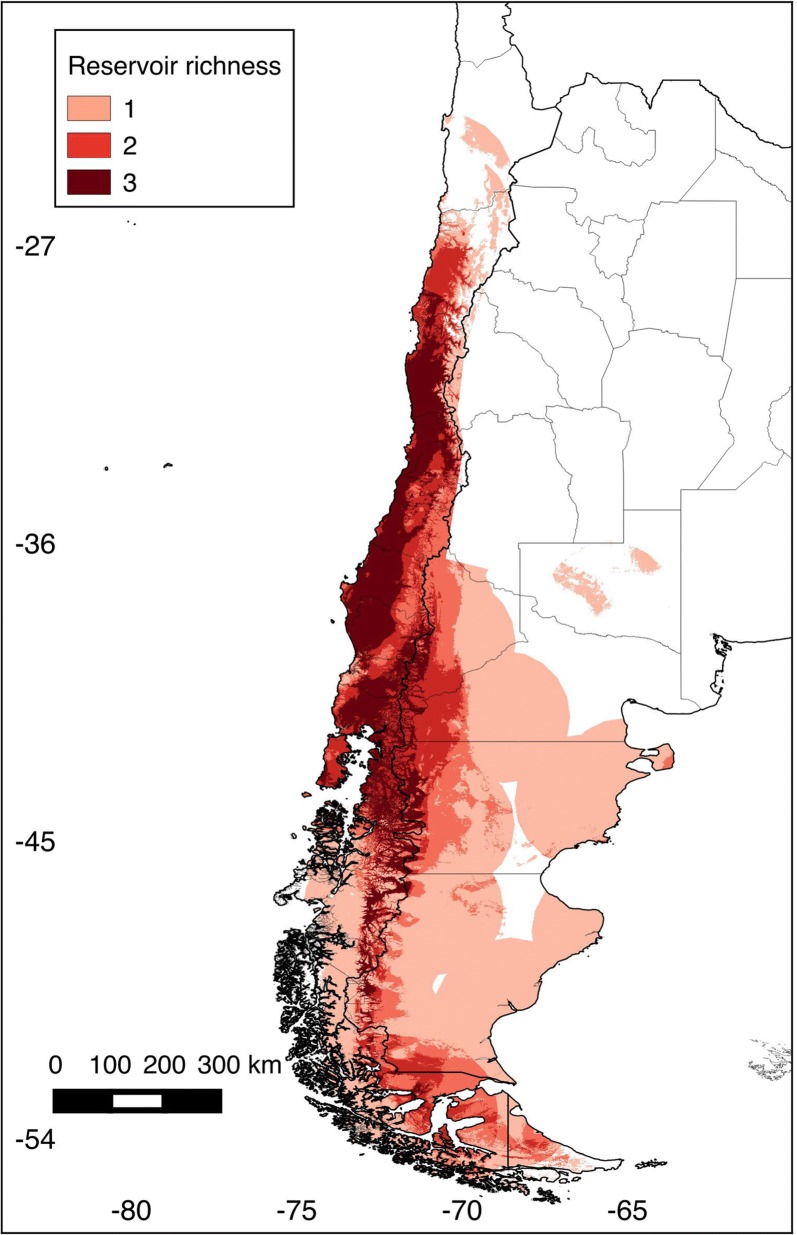
Fig. 3.
Rodent species richness (number of species predicted by cell). Chile and Argentina, divided by Regions (Chile) and Provinces (Argentina). Areas of high (dark red) to low (light pink) richness of rodent hosts were identified according to ecological niche model predictions. Values represent the number of rodent species by pixel as predicted by the ecological niche models

