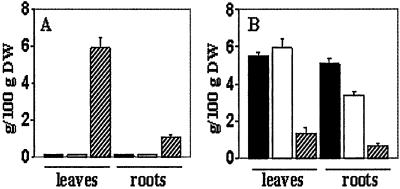
Figure 2.
Na+ and K+ contents of leaves and roots from wild-type plants grown at 10 mM NaCl (filled bars) and transgenic plants (X1OE1) grown at 10 mM NaCl (empty bars) and 200 mM NaCl (hatched line bars). (A) Na+ content. (B) K+ content. Leaves and roots were collected from 15 plants from each treatment, the material was pooled in three groups, and ion contents were measured as described in Materials and Methods. Values are the mean ± SD (n = 3).

