Figure 4.
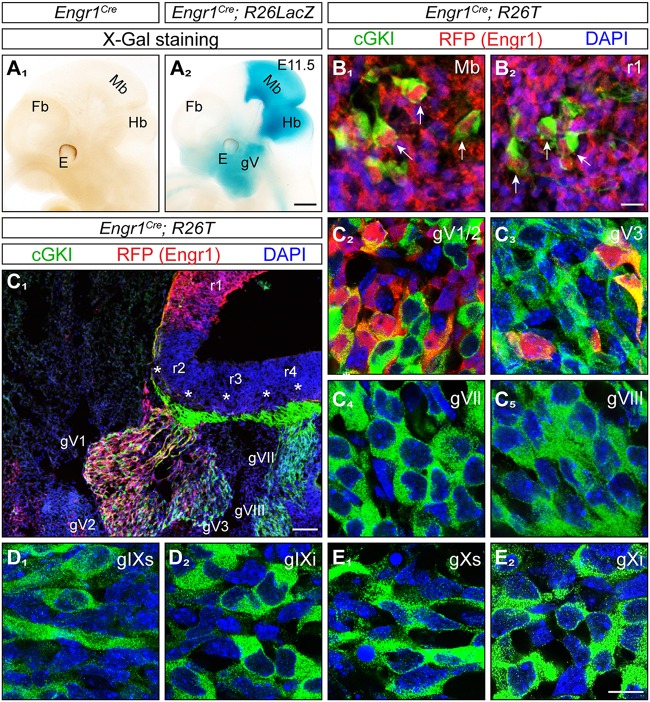
Expression of Engr1-Cre in the midbrain, hindbrain and trigeminal ganglion. (A1,2) Detection of Engr1-Cre expression in whole mounts at E11.5 using X-Gal staining of the conditional R26LacZ reporter activated by Engr1-Cre. Strong expression is observed in the midbrain, isthmus and rhombomere 1 and to a lesser extent in the trigeminal ganglion and in the region surrounding the mouth. Scale bar, 500 μm. (B1,2) Expression of Engr1-Cre in cGKI-positive cells (MTNs, indicated by arrows) in the mesencephalon or in rhombomere 1, respectively, at E11.5. Engr1-Cre is detected in red by using the conditional reporter line R26T which is activated by Engr1-Cre and counterstained by antibodies to the red fluorescent protein, cGKI in green and DAPI in blue. Scale bar, 10 μm. (C) Expression of Engr1-Cre in gV (overview in C1) and at the cellular level in gV1/2 (V1 - ophthalmic and V2 maxillary part) (C2) and gV3 (mandibular part) (C3) at 11.5. Asterisks in (C1) depict entry zones of CSGs in the hindbrain. r, rhombomere. Engr1-Cre is detected in red, cGKI in green and DAPI in blue. Scale bar in (C1), 100 μm. (C4-E2) No expression of Engr1-Cre 1 in gVII, gVIII, gIX, und gX. Engr1-Cre is detected in red, cGKI in green and DAPI in blue. Scale bar in (C2-E2) 20 μm.

