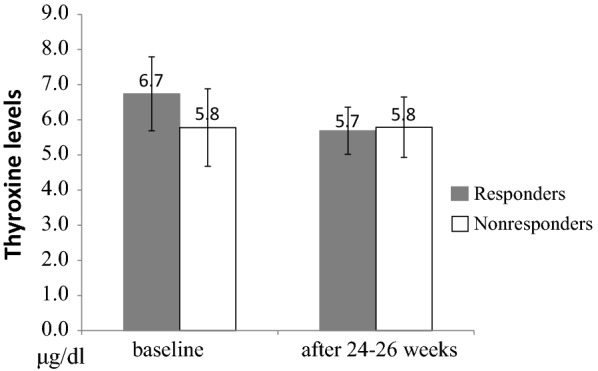
Fig. 1.

Thyroxine levels (μg/dl) in responders (gray bars) and nonresponders (white bars) to donepezil therapy at baseline and 24–26 weeks after treatment. The responders (n = 13) had with a higher baseline level of T4 compared with the non-responders (n = 8) (t(19) = 2.29, p = .033) and a significant reduction in T4 level after 24–26 weeks of donepezil treatment (F(1,12) = 13.13, p = .003)
