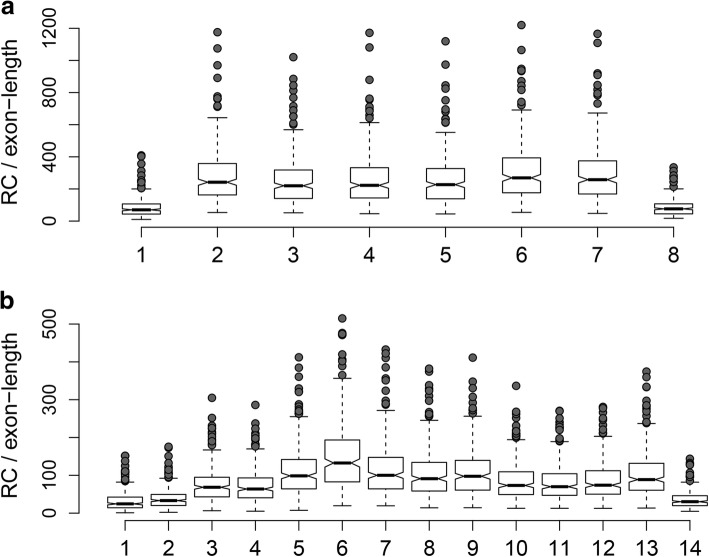
Fig. 4.
Boxplots of read counts per exon. a shows the expression levels in read counts per 100 bp for each exon in CDK1 (NB no additional normalization was performed). The whiskers extend to 1.5 IQR (interquartile range) above the third, or below the first quartile, with the median indicated by a horizontal line in the box. The notch indicates the 95% confidence interval of the median. b shows the same data for the MKI67 gene

