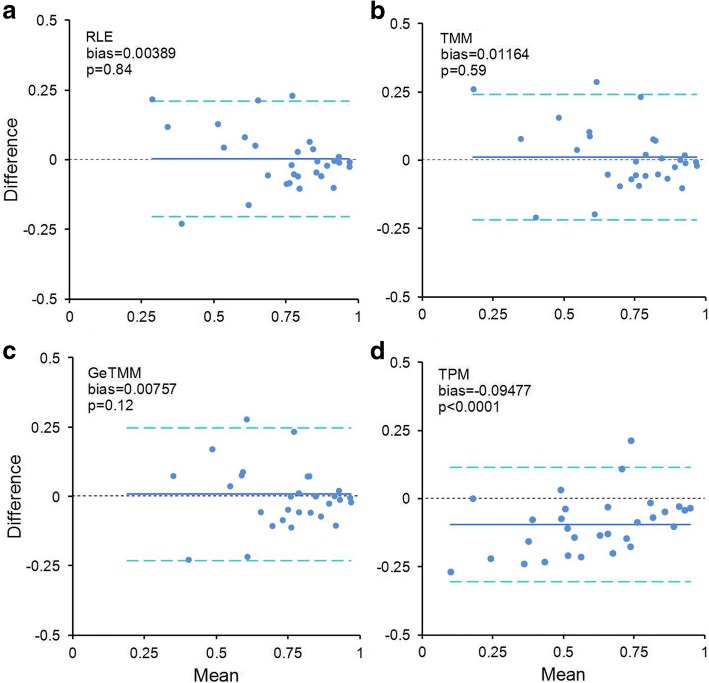
Fig. 6.
Bland-Altman plots comparing samples with high and low RIN values. a-d: for each normalization method, a group of 76 samples with low RIN values (< 7) was used to correlate expression data of 30 genes to RT-qPCR generated data. The same was performed for an equally sized high RIN sample group (> 9) and the correlation coefficients were compared. X-axis shows the mean correlation, the y-axis the difference (high RIN – low RIN). The blue line indicates the bias (mean of all differences), the dashed light-blue lines show the 95% limits of agreement, the dashed black line at zero is the identity line (indicating no difference). The p-value is derived from a one-sample t-test

