
Fig. 5.
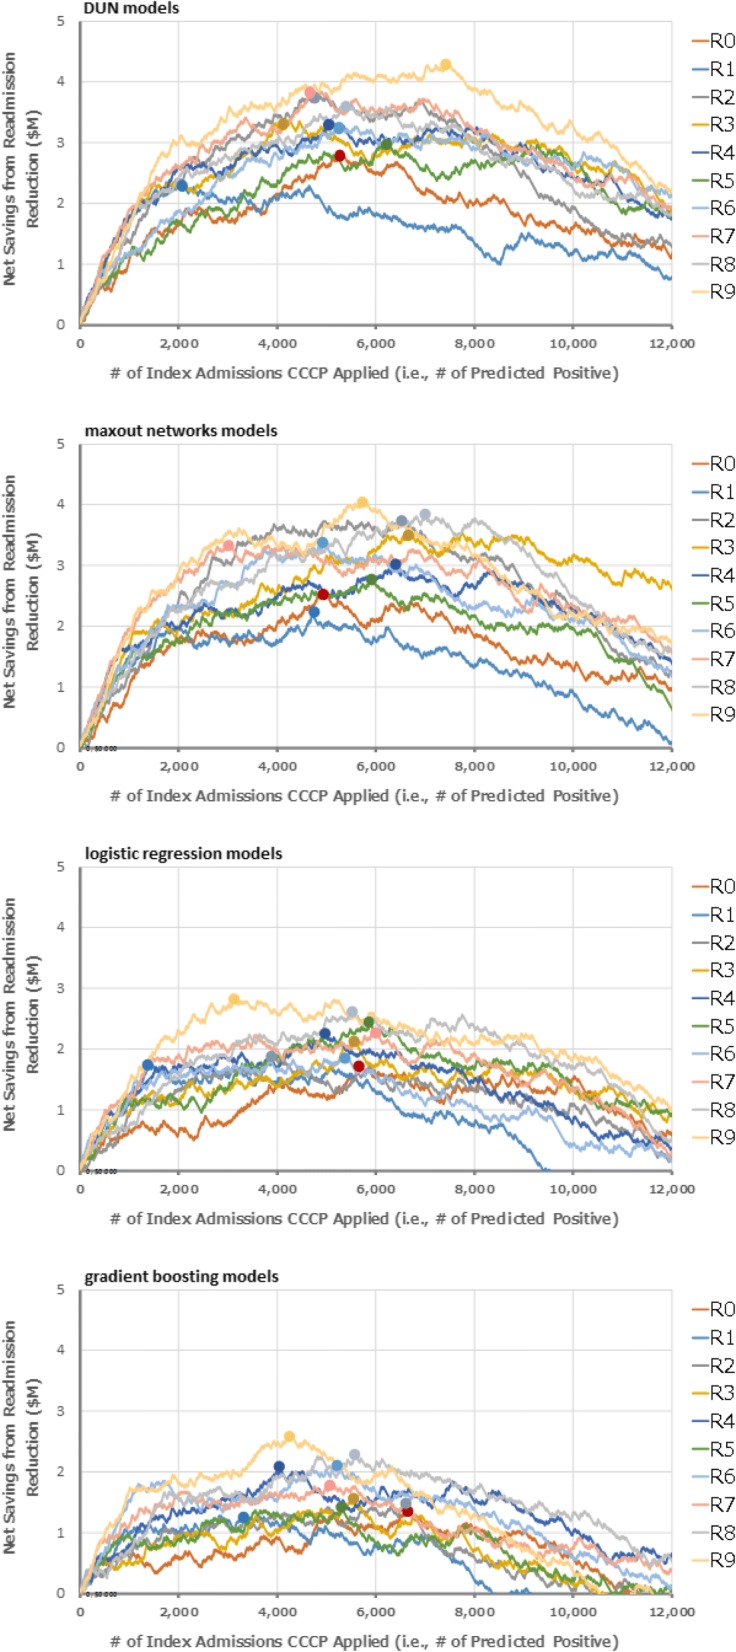
Projected net savings from readmission reduction by using prediction models to select CCCP enrollees. Shows the net savings from readmission reduction, calculated by changing the number of CCCP enrollees along with the classification threshold, using the ROC curves of 10-fold CV of 1) DUNs, 2) maxout networks, 3) logistic regression, and 4) gradient boosting as shown in Fig. 3