Fig. 1.
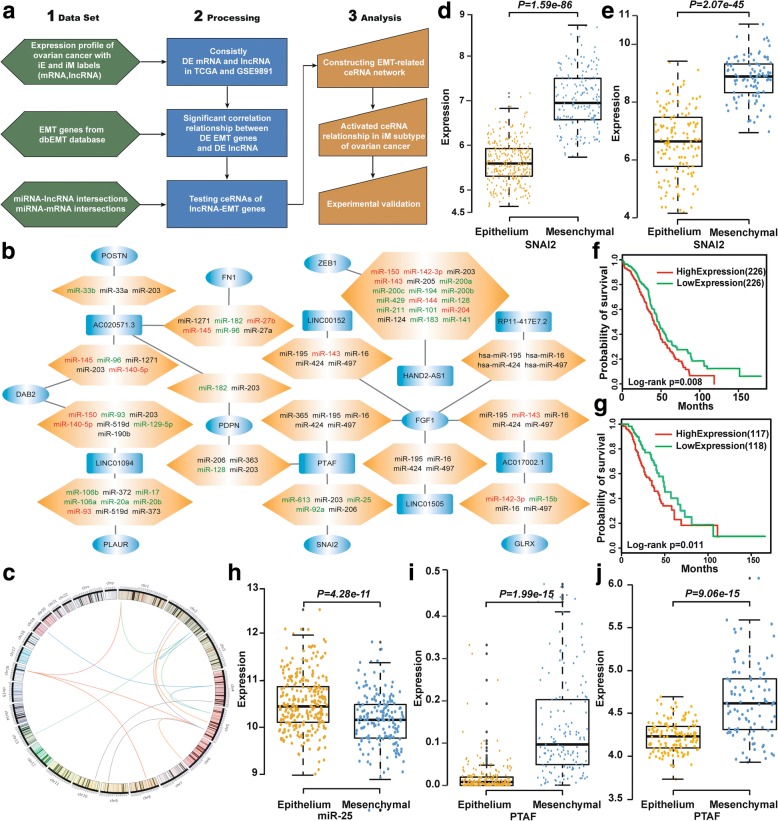
Identification of the EMT-related ceRNA regulatory network. a Flowchart of the integrative analysis. b The ceRNA network in mesenchymal OvCa. Rounded rectangles, ellipses and hexagons denote lncRNAs, EMT genes and miRNAs, respectively. The lncRNAs and EMT genes, which are shown in blue, were significantly up-regulated in mesenchymal OvCa compared with epithelial OvCa. Up-regulated miRNAs are shown in red, and down-regulated miRNAs are shown in green. c Genomic distance between lncRNAs and correlated EMT genes. SNAI2 was significantly up-regulated in mesenchymal OvCa compared with epithelial OvCa in the TCGA (d) and GSE9891 (e) data sets. Kaplan-Meier overall survival curves for OvCa patients with high and low expression of SNAI2 in the TCGA (f) and GSE9891 (g) data sets. h miR-25 was significantly down-regulated in mesenchymal OvCa compared with epithelial OvCa in the TCGA data set. The lncRNA PTAF was significantly up-regulated in mesenchymal OvCa compared with epithelial OvCa in the TCGA (i) and GSE9891 (j) data sets

