Fig. 7.
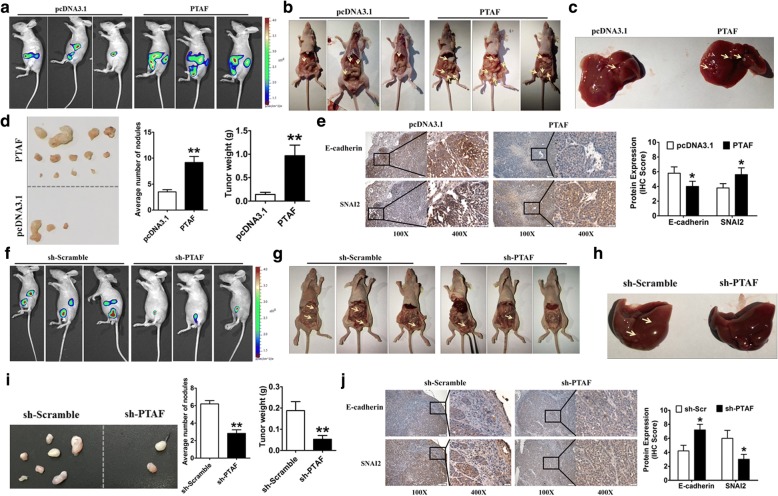
PTAF silencing inhibits tumor progression in an orthotopic mouse model of OvCa. a Representative bioluminescence images of mice injected intraperitoneally with SKOV3 OvCa cells expressing either PTAF or empty pcDNA3.1 (n = 10 in each group). b More tumor masses (yellow arrows) were formed by SKOV3-PTAF cells than by SKOV3-pcDNA3.1 cells. c Mice injected with SKOV3-PTAF cells showed liver metastases. d Representative images of tumor nodules and quantification of tumor nodules and tumor weights in mice injected intraperitoneally with SKOV3 OvCa cells expressing either PTAF or empty pcDNA3.1 (n = 10 in each group). **P < 0.01 vs. pcDNA3.1. e SKOV3-ip tumor samples from mice injected with cells expressing PTAF or empty pcDNA3.1 were immunohistochemically stained for E-cadherin and SNAI2. *P < 0.05 vs. pcDNA3.1. f Representative bioluminescence images in sh-Scramble- and sh-PTAF-treated mice (n = 10 in each group) that were injected intraperitoneally with SKOV3 OvCa cells. g Fewer tumor masses (yellow arrows) were formed in the mice treated with sh-PTAF than in those treated with sh-Scramble. h Mice injected with sh-Scramble showed liver metastases, whereas very little metastasis was observed in mice injected with sh-PTAF. i Representative images of tumor nodules and quantification of tumor nodules and tumor weights in sh-Scramble- and sh-PTAF-treated mice injected with SKOV3 cells (n = 10 for each group). **P < 0.01 vs. sh-Scramble. j SKOV3-ip tumor samples from sh-Scramble- and sh-PTAF-treated mice were immunohistochemically stained for E-cadherin and SNAI2. *P < 0.05 vs. sh-Scramble. Scale bars, 100X = 100 μm; 400X = 20 μm

