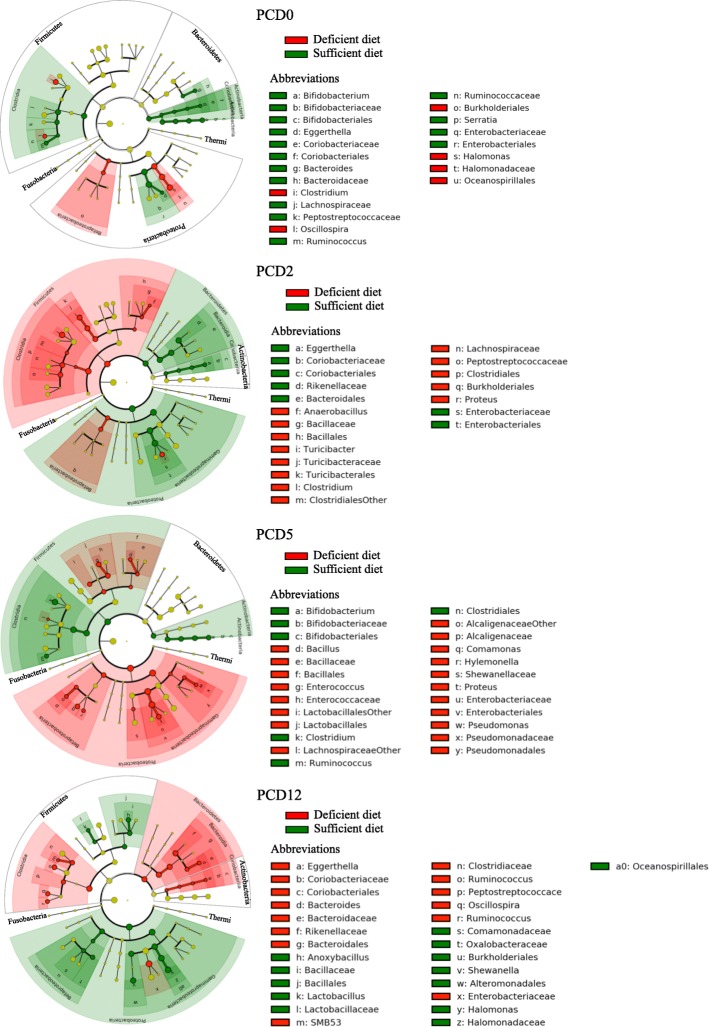
Fig. 5.
Impact of the diets on fecal microbiota of HIFM+HRV pigs. The relative abundance between deficient and sufficient diets for a given time point is shown. Results are represented via a phylogenetic tree (Graphlan), combined with relative abundance data. Labeled in red are the bacteria detected in higher abundance in deficient diet; while in green are the bacteria detected in higher abundance in sufficient diet. The labeling of the taxonomic levels from the outside (phylum) to the inside (genus), while the tree start (root) from the center and goes outside. Nodes are indicated by a circle. Bacteria (node) more abundant in one of the diets is shown in red or green, no change is shown in gold. Bacteria are designated with alphabet in red or green corresponding to the node

