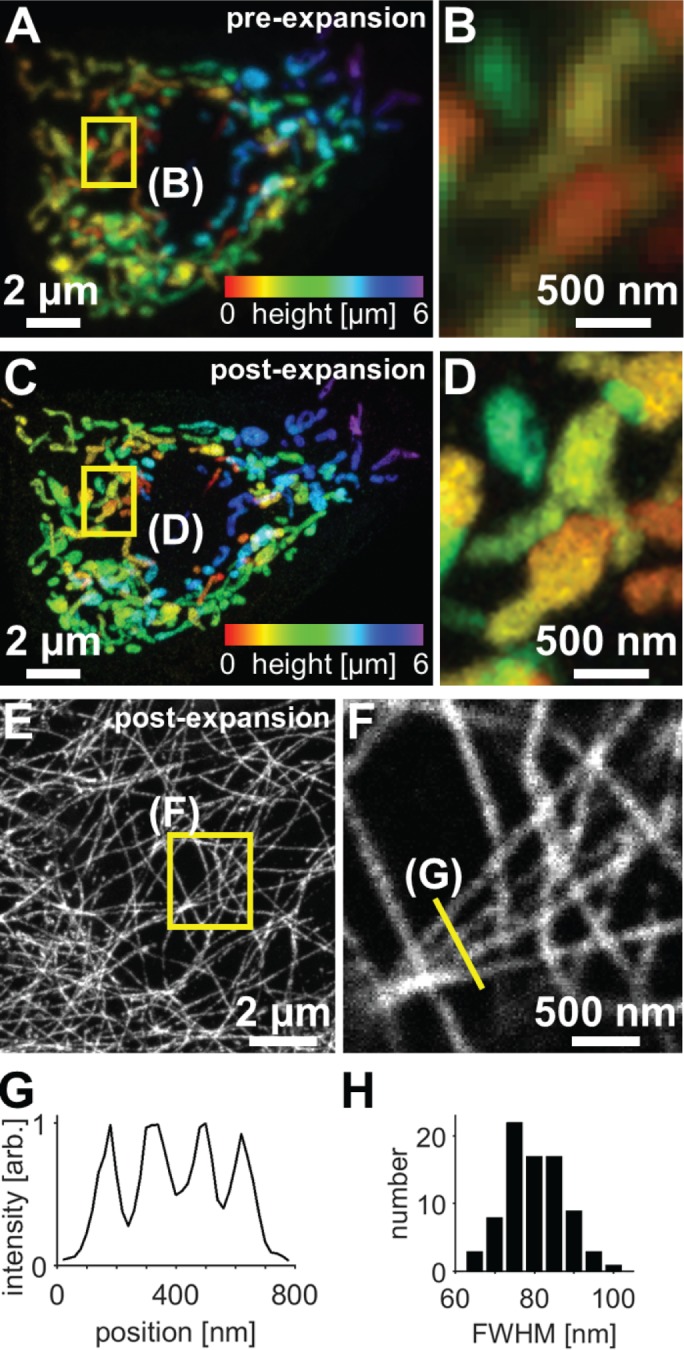
FIGURE 2:

Confocal imaging of subcellular structures in expanded Drosophila tissue samples. (A–D) Maximum-intensity projections of C4da neurons expressing mito-GFP (ppk-Gal4, UAS-mito-GFP) and immunostained for GFP, where color indicates height within the specimen. The same field of view is shown before expansion (A, B) and after expansion (C, D). (E) Maximum-intensity projections of epithelial cells immunostained for acetylated tubulin in expanded third instar larval body walls. (F) Zoomed-in views of single focal plane image corresponding to boxed regions in E. Images of epithelial acetylated tubulin in unexpanded body walls are shown in Supplemental Figure S3. (G) Line profile from F (arb., arbitrary units). (H) Analysis of microtubule widths yielded average Gaussian-fitted full-width at half-maximum (FWHM) of 83 ± 9 nm (mean ± SD, 80 microtubule profiles). Here and in all subsequent figures containing ExM data, distances and scale bars have been divided by their respective measured expansion factors of approximately four times and therefore correspond to pre-expansion dimensions.
