FIGURE 3:
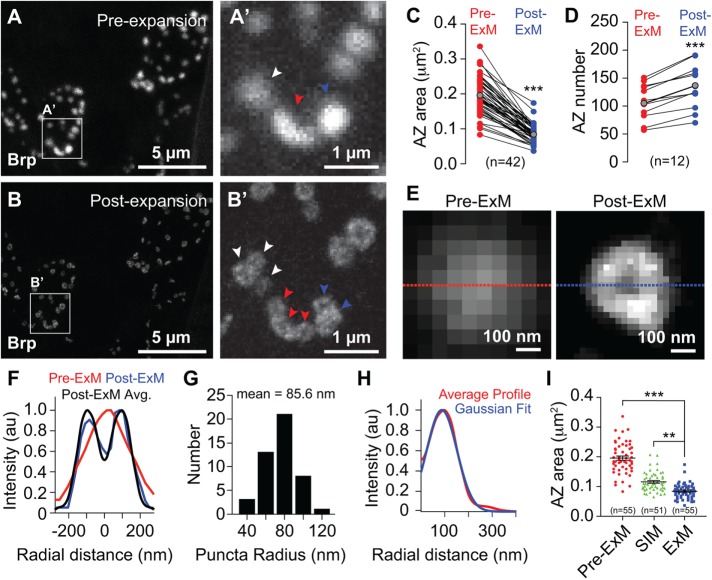
Superresolution imaging of synapses with ExM. Correlative confocal microscopy imaging of Brp staining (A) preexpansion and (B) postexpansion in third instar larvae. (A′, B′) Zoomed view of boxed regions in A and B showing AZ features resolved by ExM but not conventional confocal microscopy. Arrowheads mark individual AZs that can be resolved in correlated pre- and postexpansion samples. (C) AZ area and (D) AZ number in correlated pre- and postexpansion images. Red and blue points represent individual measurements from pre- and postexpansion samples, respectively, and lines connect paired measurements. Gray points mark mean values. ***, p < 0.001, unpaired t test with Welch’s correction. (E) Pre- and postexpansion images of a single AZ. (F) Cross-sectional profile of pre- and postexpansion images of puncta in E and average cross-sectional profile of 46 individual postexpansion AZs. (G) Distribution of puncta radii and (H) average radial Brp intensity profile of 46 individual AZs aligned according to their centers of mass. (I) AZ area measurements from Brp-stained third instar larvae imaged using a conventional confocal microscope (preexpansion and postexpansion) or using SIM. Note that SIM imaging was performed on unexpanded tissue (see Supplemental Figure S4). Number of AZs measured for each imaging modality is shown. **, p < 0.01, ***, p < 0.001 compared with ExM, one-way analysis of variance (ANOVA) with a post hoc Dunnett’s test. All distances, areas, and scale bars correspond to preexpansion dimensions.

