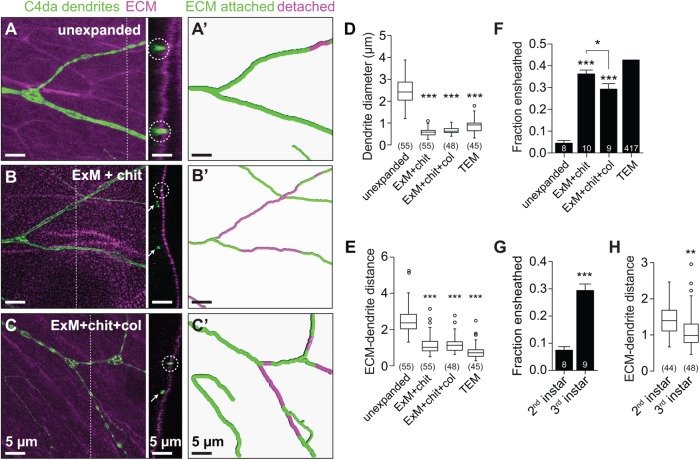
FIGURE 5:
Improved axial resolution facilitates analysis of cell–cell interactions. (A–C) Axial position of dendrites and ECM. Maximum-intensity projections are shown for the following fillet preparations of larvae expressing the C4da-specific marker ppk-CD4-tdTomato: (A) unexpanded body walls, (B) expanded body walls of larvae treated with chitinase (ExM + chit), and (C) expanded body walls of larvae treated with chitinase and collagenase (ExM+chit+col), each stained with antibodies to perlecan to label the ECM and to DsRed to label C4da dendrites. Dashed lines mark y,z cross-sectional positions shown to the right of each image. Circles mark ECM-contacting dendrites, and arrows mark ECM-detached dendrites. (A′–C′) Traces depict ECM-contacting dendrites in green and ECM-detached dendrites in magenta. Plots depict (D) dendrite diameter, (E) the distance between detached dendrites and the ECM, and (F) the fraction of dendrites detached from the ECM measured using the indicated imaging approaches. (G) The fraction of dendrites detached from the ECM and (H) distance between detached dendrites and the ECM are shown for the indicated stages. Lines depict mean and SD in F and G. *, p < 0.05, ***, p < 0.005 compared with unexpanded samples, unless otherwise indicated, one-way ANOVA with a post hoc Dunnett’s test in D–F. TEM samples were excluded from statistical analysis in E because the number of neurons sampled by TEM is not known. **, p < 0.01, ***, p < 0.005 compared with second instar samples, unpaired t test with Welch’s correction in G and H. n values represent the number of dendrites scored (D, F, and H; TEM values in E) or neurons analyzed (F and G). Scale bars: 5 µm. All distances and scale bars refer to preexpansion dimensions.

