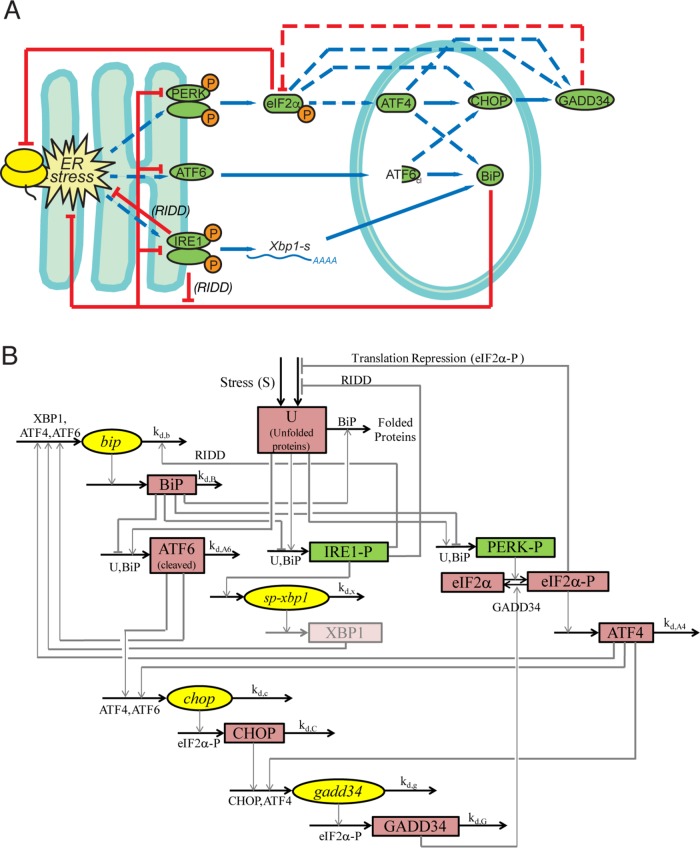
FIGURE 2:
Modeled relationships among UPR components. (A) Schematic showing the relationships among UPR components accounted for by the model, with blue lines indicating stimulatory interactions and red lines inhibitory ones. Dashed lines denote relationships examined by in silico manipulation. (B) Wiring diagram depicting the same relationships shown in A, along with the relevant rate constants. The model simulates the concentration level for four specific mRNA (ellipse; yellow) and seven specific protein (rectangle; red) species (see Table 1, Eqs. 4–14). It also shows unfolded proteins. It defines PERK and IRE1 phosphorylation (rectangle; green) and free BiP (not shown in the wiring diagram) as functions of the unfolded proteins and total BiP (Table 1, Eqs. 1–3). For simplification purposes, Bip mRNA is here responsive to Xbp1 mRNA, used as a proxy for XBP1 protein, which is not explicitly modeled.

