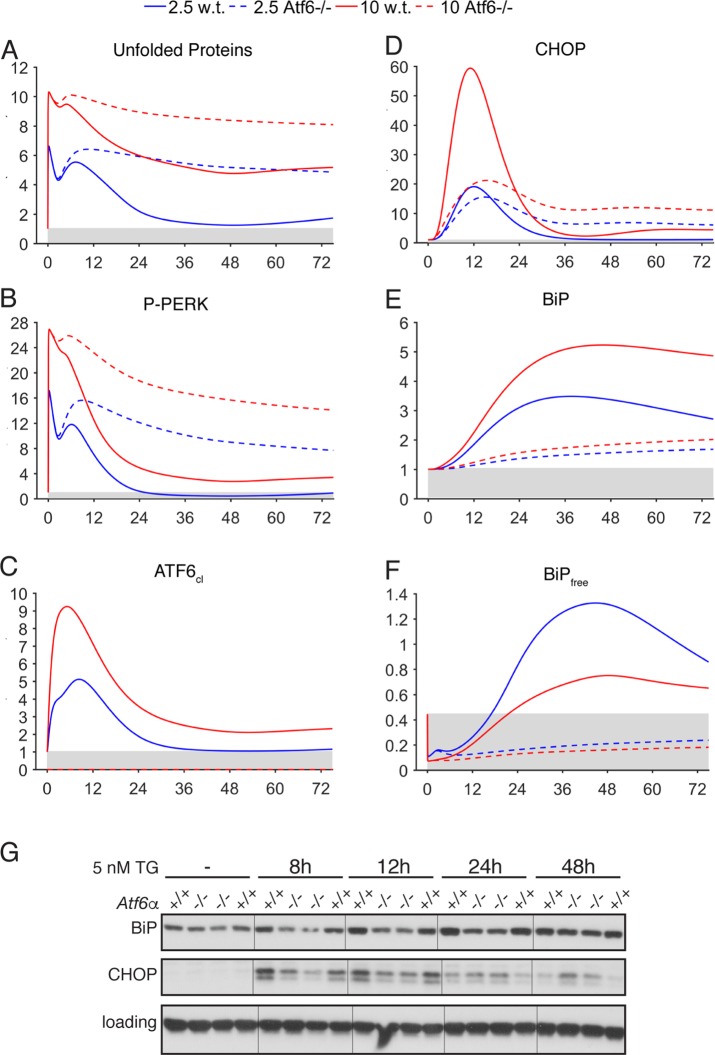
FIGURE 4:
Comparison of model and experimental outputs for deletion of ATF6α. (A–F) Selected model outputs are shown after ATF6α was deleted in silico (dashed lines), compared against outputs in wild-type simulations (solid lines). (G) Wild-type or Atf6–/– MEFs (two independent lines of each; genotype indicated above each panel) were treated with 5 nM TG for the indicated times, and expression of BiP and CHOP was assessed by immunoblot. See also Supplemental Figure S5. Loading control was a-actin. Hairlines are for visual clarity only.

