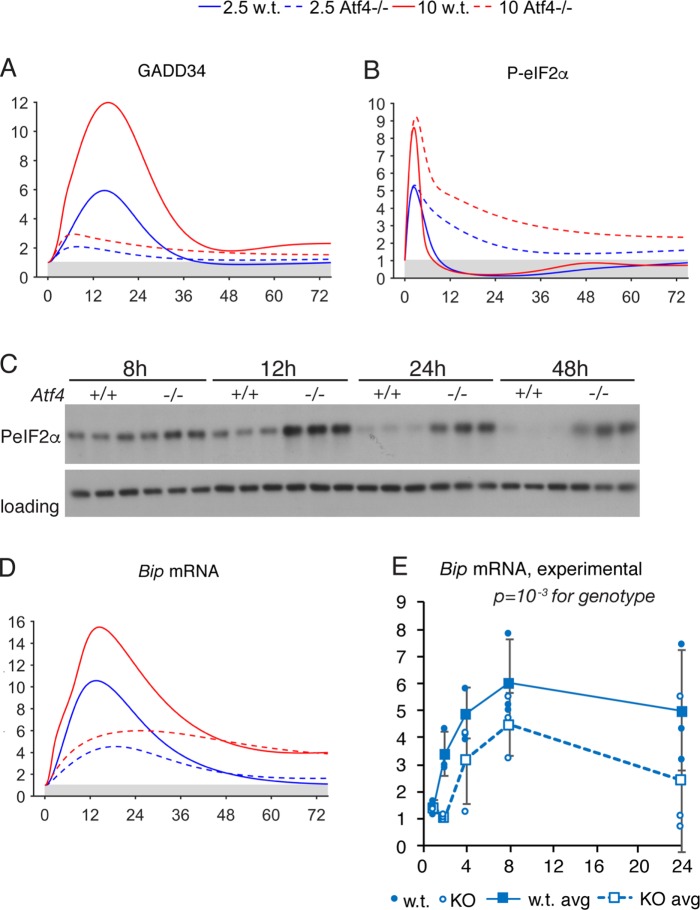
FIGURE 5:
Comparison of model and experimental outputs for deletion of ATF4. (A, B, D) Selected model outputs are shown after ATF4 was deleted in silico (dashed lines), compared against outputs in wild-type simulations (solid lines). (C) Immunoblot showing the phosphorylated form of eIF2α upon treatment of wild-type or Atf4–/– MEFs with 2.5 nM TG for the indicated times. Loading control was calnexin. (E) qRT-PCR quantifying Bip mRNA expression in wild-type or Atf4–/– MEFs upon treatment with 2.5 nM TG for the indicated times. Data were normalized against expression in cells of the same genotype treated with vehicle. Significance was calculated by two-way ANOVA for time and genotype.

