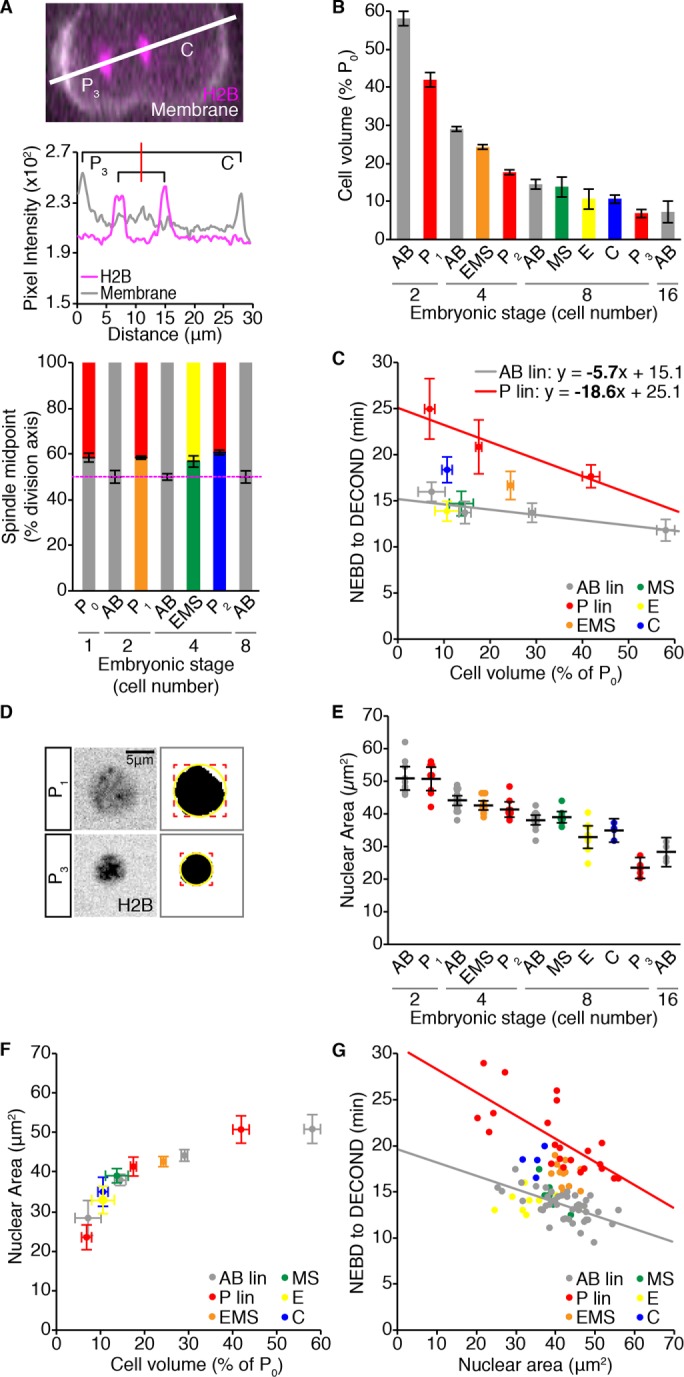
FIGURE 2:

Differences in cell size do not account for the difference in duration of monopolar mitoses between germline and somatic cells during embryonic development. (A) Representative image of a dividing P2 cell expressing the cell membrane marker mNeonGreen::PH (mNG, white) and H2B::mCH (magenta). White line shows the axis of cell division. P3 is to the left and C is to the right. Pixel intensity values for each channel along this line are shown below. The red line indicates the spindle midpoint. Displacement of the spindle midpoint along the axis of division was used to calculate the average symmetry or asymmetry of division for the listed cells, which is graphed below. Error bars show the SD of the mean. (B) Volume estimates for the listed cells, represented as a percentage of the starting embryonic volume (P0) and calculated from the spindle displacement measurements shown in A. Error bars show the SD of the mean. (C) Mean cell volume vs. mean duration of monopolar mitoses for cells from 2- to 16-cell stage embryos. Monopolar mitosis duration measurements are reproduced from Figure 1E. Horizontal error bars show SD. Vertical error bars show the 95% confidence interval for the mean. Linear least -squares regression models for germline P (red; n = 22, r = −0.72, p = 1.36 × 10⁻⁴) and somatic AB (gray; n = 44, r = −0.62, p = 5.85 × 10⁻⁶) lineages are shown. Statistically different regression coefficients are written in bold and were compared using a nonparametric bootstrap (p = 0.028 for slope). (D) Sum projections through the center of an H2B::mCH-marked P1 (top) and P3 (bottom) nucleus 1 min before NEBD, with the corresponding segmented image to the right. A bounding box (red) was fit to the segmented nucleus and used to calculate the radius of a circle (yellow) that approximates nuclear area. Scale bar = 5 μm. (E) Pre-NEBD nuclear area measurements for cells from 2- to 16-cell stage embryos, for which the duration of monopolar mitoses was measured in Figure 1E. Black bars show the mean. Error bars represent the 95% confidence interval for the mean. (F) The scaling relationship between mean nuclear area and mean cell volume. Horizontal error bars show SD. Vertical error bars show the 95% confidence interval for the mean. (G) Nuclear area vs. the duration of monopolar mitoses. Lines show the linear least-squares regression fit for germline P lineage cells (red; n = 22, r = −0.73, p = 9.89 × 10⁻⁵) vs. somatic AB lineage cells (gray; n = 40, r = −0.61, p = 2.82 × 10⁻⁵). (C) For B and D, p values for Pearson’s coefficient (r) were determined using Student’s t distribution. For all panels, cells are color-coded as in Figure 1A. See Supplemental Table S2 for summary statistics.
