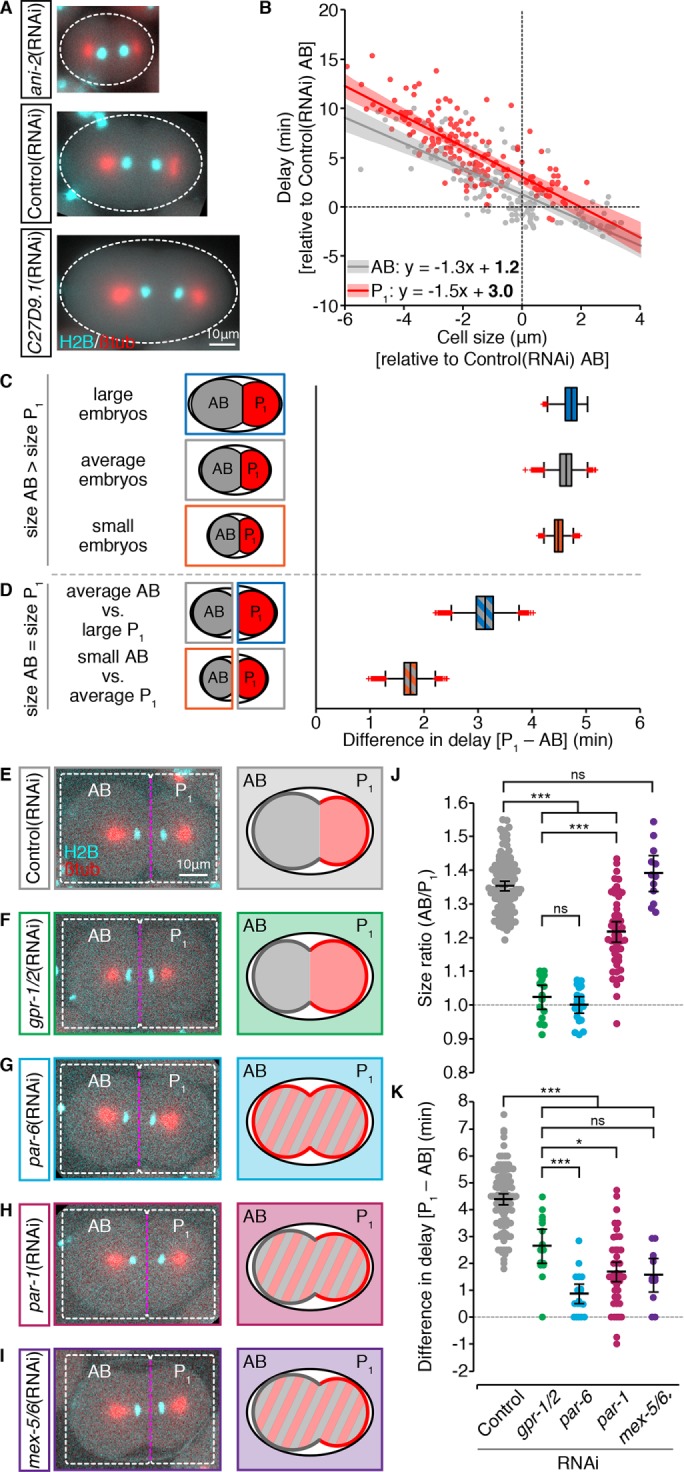
FIGURE 4:

In two-cell stage embryos cell size and asymmetric cytoplasmic partitioning contribute equally to differential checkpoint strength between the somatic AB and germline P1 cell. (A) Representative images of zyg-1(or297ts), H2B::mCH (cyan), β-tubulin::GFP (red) embryos following RNAi depletion of ANI-2 or C27D9.1, as compared with control. Scale bar = 10 μm. Anterior is to the left. (B) The duration of monopolar mitoses, NEBD to DECOND, relative to cell size, in somatic AB (gray; n = 155) and germline P1 (red; n = 167) cells following RNAi-induced changes in embryo volume. Cell volume measurements were converted into the radius of the corresponding sphere ( ), which we call “cell size.” All measurements are expressed relative to (±) the mean value for corresponding Control(RNAi) AB cells. Lines represent the linear least-squares regression fit with 95% confidence interval (shaded regions). Linear regression models are shown with statistically different (p < 0.05) coefficients in bold. Regression coefficients were compared using a nonparametric bootstrap (p = 0.055 for slope; p = 0 for y-intercept). (C, D) Schematic and resulting boxplot showing the nonparametric bootstrap analysis of data from B to estimate the difference in the duration of monopolar mitoses between somatic AB and germline P1 cells when AB is larger than P1 (C) vs. when AB and P1 are the same size (D). See Materials and Methods and Supplemental Table S2 for details. Box edges are the 25th and 75th percentiles; whiskers extend to the most extreme data points. Outliers are plotted individually in red. (E–I) Representative images of zyg-1(or297ts), H2B::mCH (cyan), β-tubulin::GFP (red) embryos following RNAi depletion of GPR-1/2 (green), PAR-6 (blue), PAR-1 (maroon), and MEX-5/6 (purple) compared with Control(RNAi) (gray), showing the position of the spindle midpoint (magenta dashed line) along the anterior-to-posterior axis of P0. Scale bar is 10 μm. Anterior is to the left. A schematic representing the expected cell sizes, cytoplasmic asymmetry, and cortical polarity resulting from each RNAi condition is shown on the right. Anterior cortex and cytoplasm are in gray. Posterior cortex and cytoplasm are in red. (J, K) Cell size ratio [AB/P1] (J) and the difference in the duration of monopolar mitoses [P1-AB] (K) for AB/P1 sibling pairs from embryos treated as in E–I. Black bars represent the mean. Error bars show the 95% confidence interval for the mean. ns = p ≥ 0.05; * = 0.01 < p < 0.05; *** = p < 0.001 by an Anova1 with Tukey-Kramer post hoc test. See Supplemental Table S2 for summary statistics.
