FIGURE 1:

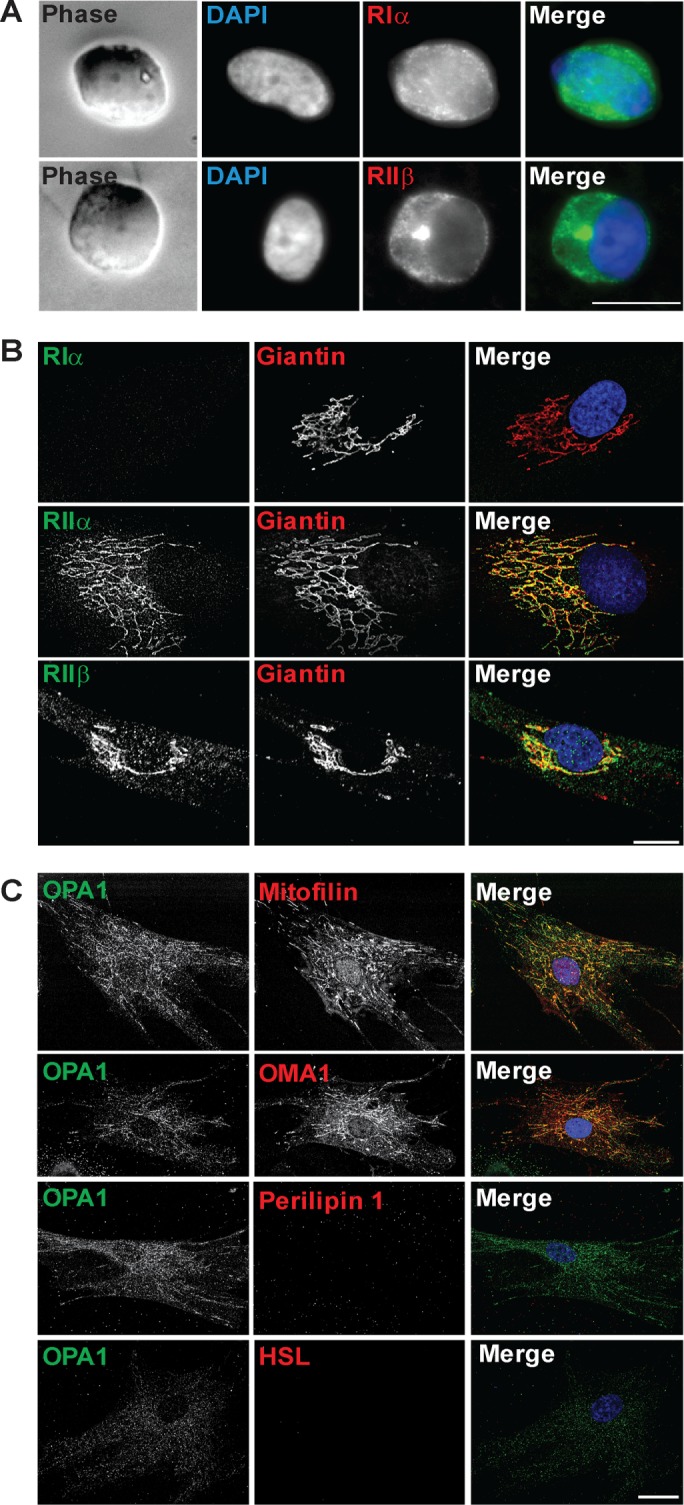
Subcellular localization of PKA and OPA1 in hASCs. Representative images show (A) uncultured isolated hASC stained with RIα or RIIβ (green) and DAPI (blue); (B) cultured hASCs (P7-8) stained for RIα, RIIα, or RIIβ (green) and Giantin (red); and (C) hASCs (P7-8) stained for OPA1 (green) and Mitofilin, OMA1, perilipin, or HSL (red). DAPI (blue) included in merged pictures (n = 3 donors). Scale bar: 10 µm.
