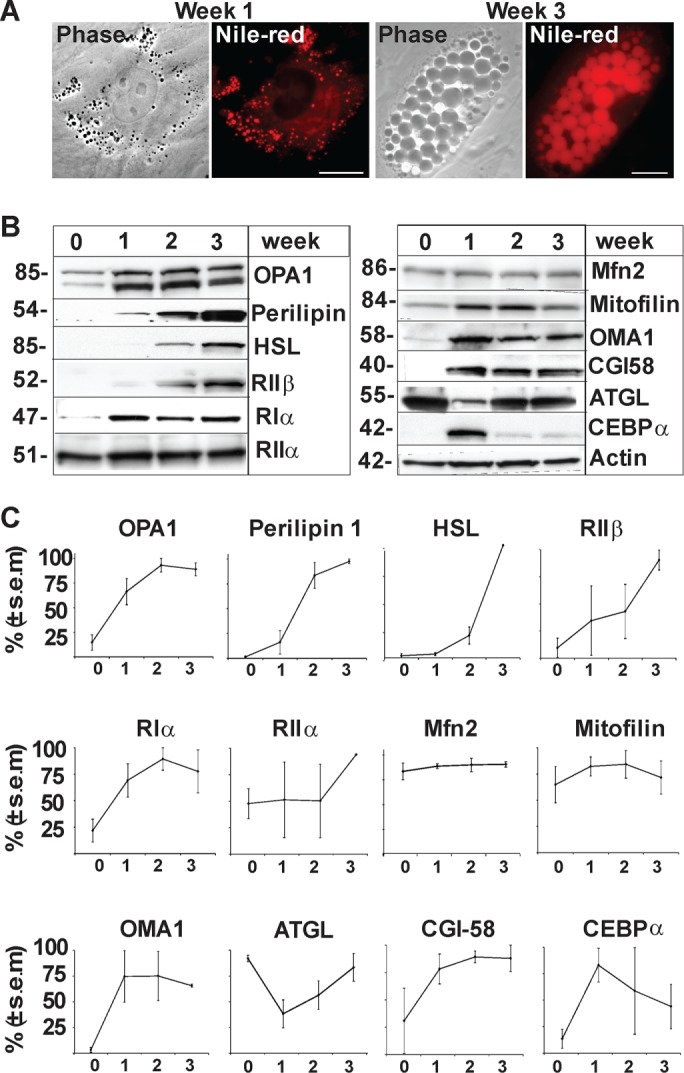
FIGURE 2:

Regulation of OPA1 and adipocytic markers during adipocyte differentiation of hASCs. (A) LDs in hACSs were visualized with Nile Red at weeks 1 and 3 of adipocyte differentiation. (B) Levels of endogenous OPA1, perilipin 1, HSL, RIIβ, RIα, RIIα, Mfn2, Mitofilin, OMA1, CGI-58, ATGL, CEBPα and Actin detected by Western blot analysis in one representative donor (Donor B) during adipocyte differentiation (weeks 0, 1, 2, and 3). (C) Amalgamated data from densitometric analysis of three donors (Donor B in panel B and Donors A and C in Supplemental Figure 1) (mean ± SEM, n = 3 donors).
