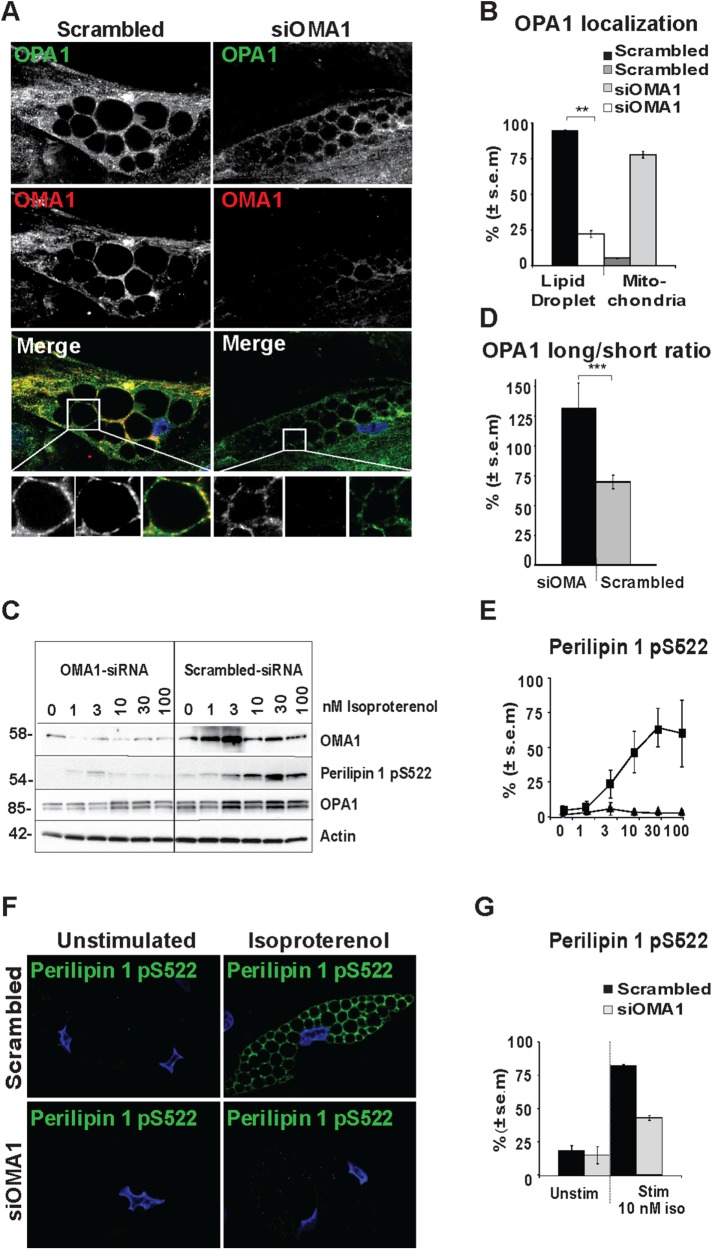
FIGURE 7:
Consequences of OMA1 knockdown for LD localization of OPA1 and perilipin 1 S522 phosphorylation. hASC-derived adipocytes were transfected with OMA1 siRNA or scrambled control and subjected to immunostaining for OPA1 (green) and OMA1 (red). Bottom: zoom from the area indicated by dotted squares in the original image. DAPI is included in merged pictures (A). Scale bars: 10 µm. Statistical analysis of OPA1 localization in cells immunostained as representative images in A. OPA1 staining was categorized as 1) in defined mitochondrial structures only or 2) localized to LDs in addition to mitochondria (100 cells counted for each donor and condition; shown mean ± SEM of n = 3 donors, **p < 0.005) (B). hASC-derived adipocytes transfected with OMA1 siRNA or scrambled control were stimulated with 0–100 nM isoproterenol as indicated to assess the presence of OMA1, perilipin 1 pS522, OPA1, and actin (C). Statistical analysis of the presence of the long vs. the short OPA1 isoforms in scrambled control vs. OMA1 knockdown as in C (shown mean ± SEM of n = 18, ***p < 0.0005 of scrambled control vs. OMA1 knockdown) (D). Densitometric analysis of perilipin 1 S522 phosphorylation as in C normalized to actin expression under scrambled control (▪) or siOMA1 (▴) conditions (mean ± SEM of n = 3) (E). Immunofluorescence of perilipin 1 pS522 (green) in hASC-derived adipocytes transfected with OMA1 siRNA or scrambled control incubated with or without 10 nM of isoproterenol counterstained with DAPI (blue) (F). Scale bars: 10 µm. Statistical analysis of immunostained cells as in F (100 cells counted for each donor and condition; shown mean ± SEM of n = 3 donors) (G).

