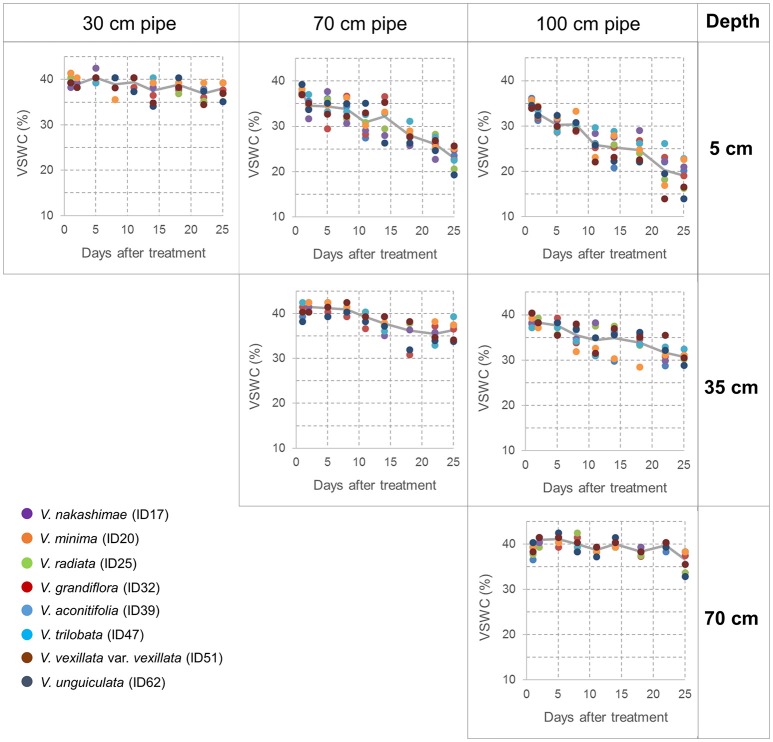
Figure 2.
Time-course changes in the volumetric soil water content (VSWC) measured at midday during the drought treatment. Values of VSWC at 5 cm depth of 30-cm pipes (left column), at 5 and 35 cm depths of 70-cm pipes (center column), at 5, 35, and 70 cm depths of 100-cm pipes (right column). Each data point is the value for one pipe (planted with one accession), and data of eight pipes are shown at each time point. The lines represent the averages of the eight pipes.

