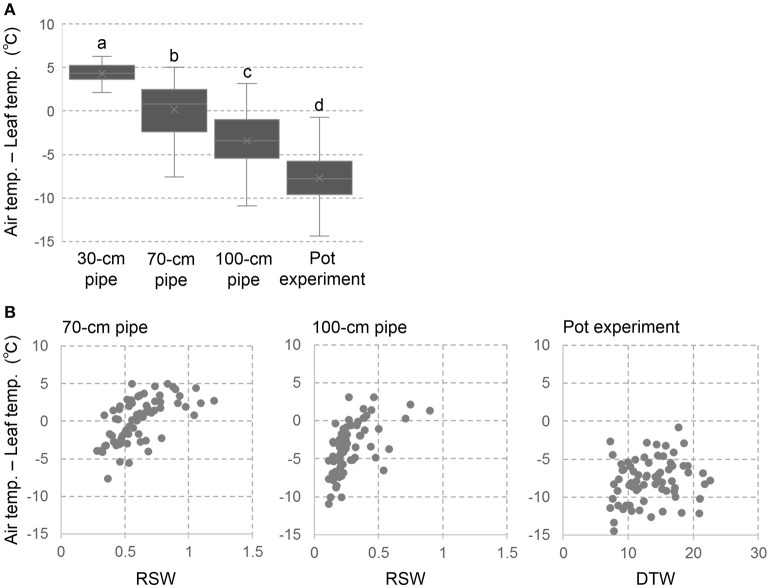
Figure 3.
Temperature difference between ambient air and leaf surface (Ta-Ts) in the pipe and pot experiments. (A) box plots of Ta-Ts for the 69 accessions. Different letters represent significant differences at p < 0.05 level. (B) Relationships between Ta-Ts and RSW in the pipe experiment or DTW in the pot experiment.

