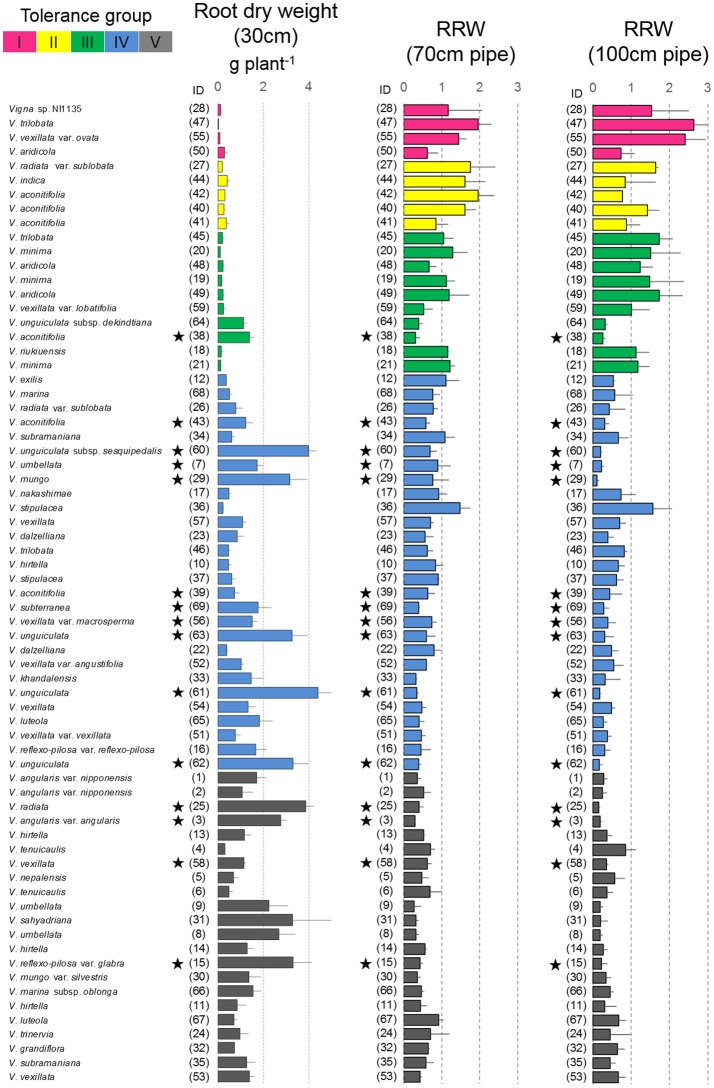
Figure 5.
Drought response of root dry weights in the pipe experiment. The root dry weight for 30-cm pipes and the relative ratios (RRW) for 70 and 100-cm pipes are shown. Data of RRW are the averages ± standard errors for the three trials. The five groups identified by cluster analysis are indicated using different colors, same as shown in Figure 4. Stars indicate domesticated accessions.

