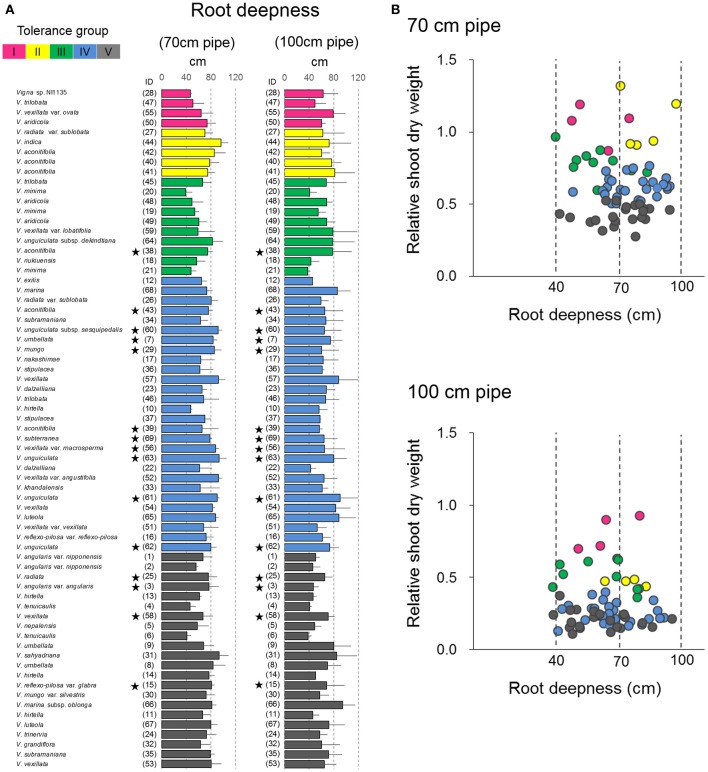
Figure 8.
Drought response of root depth in the 69 accessions. (A) The maximum root length in the 69 accessions and (B) relationships between the maximum root length and RSW in the pipe experiment. Data of root length are the averages and the error bars are standard errors for the three trials. The five groups identified by cluster analysis are indicated in different colors as shown in Figure 4. Stars indicate domesticated accessions.

