Figure 3.
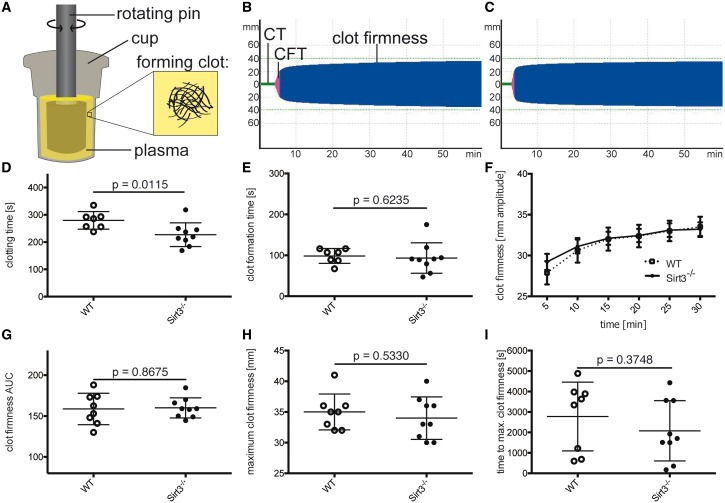
Cell depletion of Sirt3−/− blood rescues clot formation time and clot firmness, but not time to initiation of clotting. Murine plasma depleted of all cells was analysed using ROTEM (A). Once the factors in the plasma started to coagulate, the rotation of the pin was restricted and the kinetics translated to a TEMogram. Representative pictures show the TEMogram from WT (B) compared to Sirt3−/− plasma (C). Clotting time was reduced in Sirt3−/− vs. WT plasma (D). No differences could be observed in all other parameters after depleting the blood of cellular components (E–I). n ≥ 7, Student’s t-test was used to analyse graphs (D) and (E) and graphs (G–I) were analysed with the Mann–Whitney test. CT, clotting time (time until initiation of clotting); CFT. clot formation time (time between initiation of clotting and a clot strength of 20 mm amplitude).

