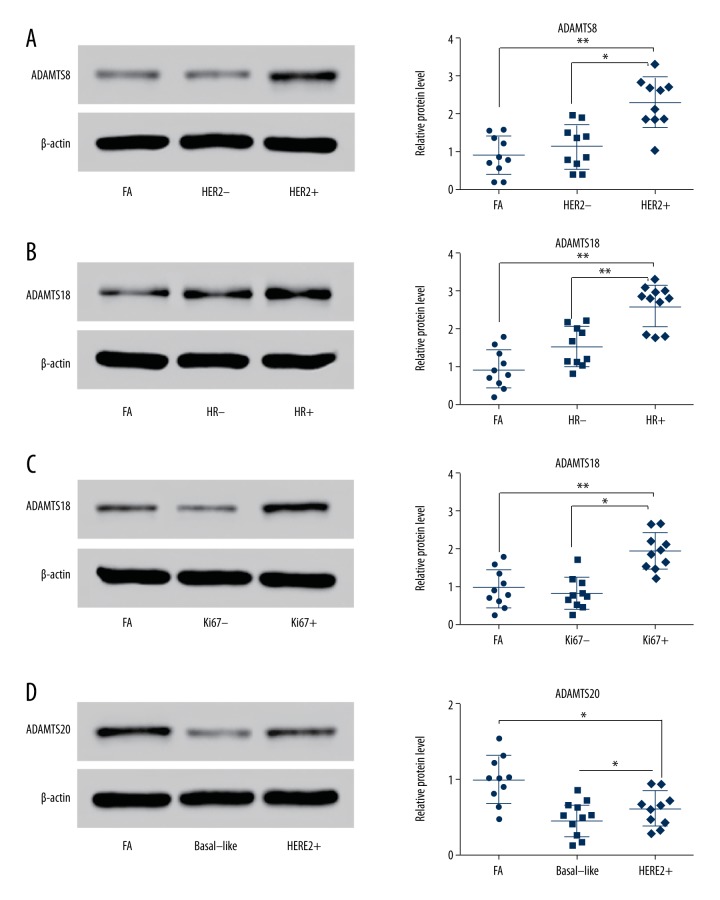
Figure 2.
Western blot results of overexpression of ADAMTS8, ADAMTS18, and ADAMTS20 proteins in IDC tissue samples. (A) Specific ADAMTS8 protein bands were observed in the FA group, HER2− group, and HER2+ group. Overexpression of ADAMTS8 was positively correlated with the expression level of HER2. (B) Specific ADAMTS18 protein bands were observed in the FA group, HR− group, and HR+ group. Overexpression of ADAMTS18 was positively correlated with the expression level of HR. (C) Specific ADAMTS18 protein bands were observed in the FA group, Ki67− group, and Ki67+ group. Overexpression of ADAMTS18 was positively correlated with the expression level of Ki67. (D) Specific ADAMTS20 protein bands were observed in the FA group, basal-like group, and HER2+ group. The results indicated that ADAMTS20 in the HER2+ group was higher than in the Basal-like group, but lower than in the FA group.

