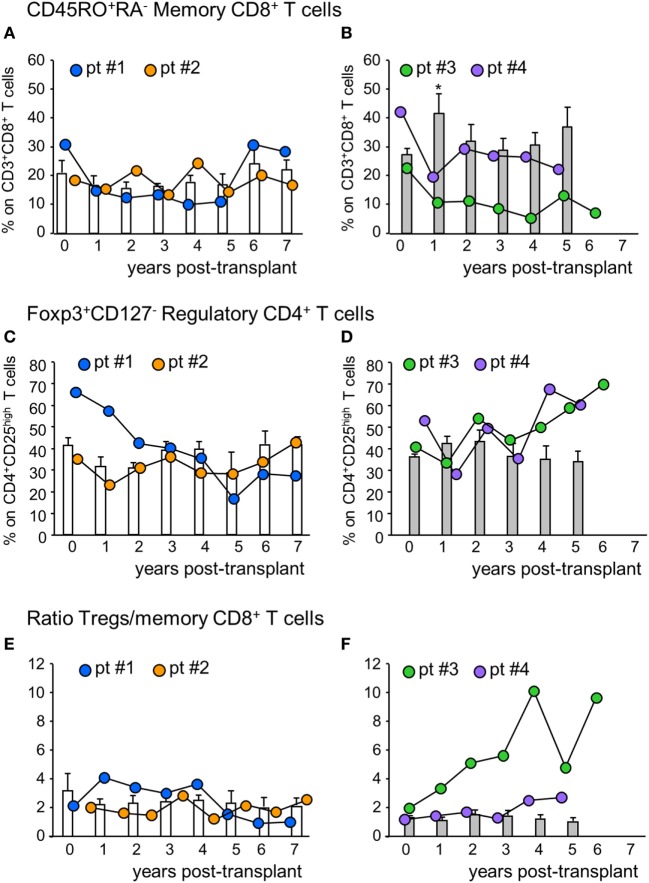
Figure 3.
Profile of circulating memory CD8+ T cells and regulatory T cells. Percentages of CD45RO+RA− memory CD8+ T cells (on CD3+CD8+ T cells) in mesenchymal stromal cell (MSC)-treated patients #1 (blue circles), #2 (orange circles) and in control kidney transplant recipients given basiliximab/low-dose rabbit anti-thymocyte globulin (RATG) induction therapy but not MSC (white histograms) during the follow-up (A) and in MSC-treated patients #3 (green circles) and # 4 (violet circles) and in control kidney transplant recipients given induction therapy with low-dose RATG alone but not MSC (gray histograms) during the follow-up (B). Panels (C,D) represent profile of percentages of regulatory T cells (Tregs) (Foxp3+CD127− on CD4+CD25high T cells) during the follow-up in MSC-treated patients #1 and #2 and in control patients given basiliximab/low-dose RATG (white histograms) and in MSC-patients #3 and #4 and in control patients given induction therapy with low-dose RATG alone (gray histograms), respectively. Ratio of Treg/memory CD8+ T cell percentages in MSC-treated patients and in control groups are shown in panels (E,F). Data from controls are mean ± SEM, *P < 0.05 vs pretransplant values.

