Figure 7.
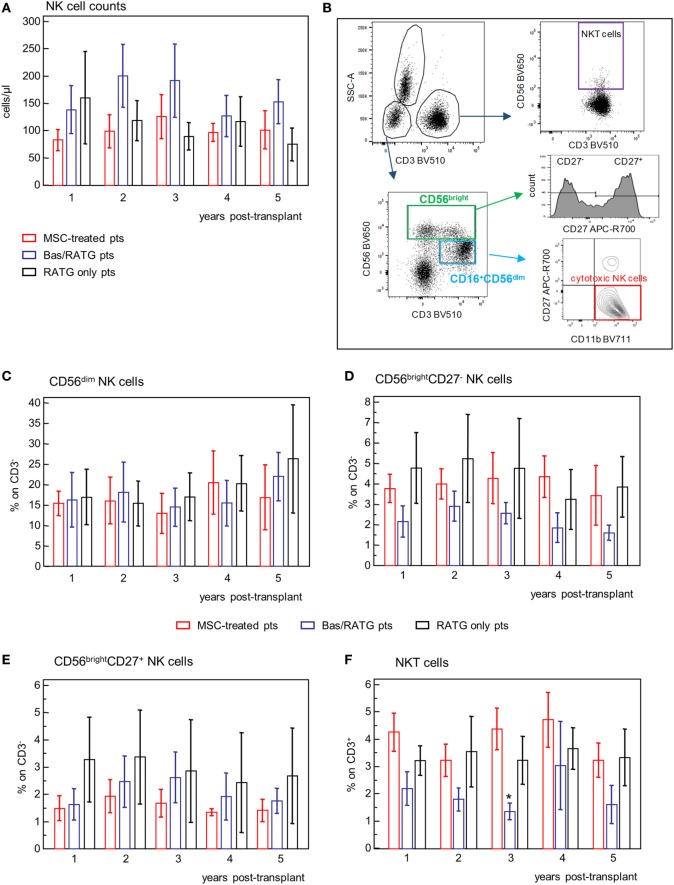
Profile of circulating NK cell subsets. (A) Profile of NK cell counts in mesenchymal stromal cell (MSC)-treated patients (n = 4), and kidney transplant patients undergoing induction therapy with bas/low dose rabbit anti-thymocyte globulin (RATG) (n = 6) or with low-dose RATG alone (n = 5) from 1 to 5 years posttransplant. Data are mean ± SEM. P = NS. (B) Gating strategy for identification of natural killer cell subsets and natural killer T cells. In the CD45+ live singlet cells, the population of CD3− lymphocytes was gated on the morphology based on SSC and plotted for CD16 and CD56 expression. CD16+CD56dim cells positive for CD11b expression and negative for CD27 were identified as cytotoxic NK cells. The CD56bright CD16−/+ NK cells were divided into CD27+ and CD27− subpopulations. NKT cells were defined as CD3+CD56+ cells. The frequency (% on the gated CD3− population) of CD56dim NK cells, CD56bright NK cells negative or positive for CD27 expression, and of NKT cells (% on CD3+ cells) in patients given MSC infusion and in kidney transplant patients undergoing induction therapy with bas/low dose RATG or with low-dose RATG alone from 1 to 5 years posttransplant are reported in panels (C–F), respectively. Data are mean ± SEM, *P < 0.05 vs MSC-treated patients and control patients given low-dose RATG at the same time point.

