FIGURE 4:
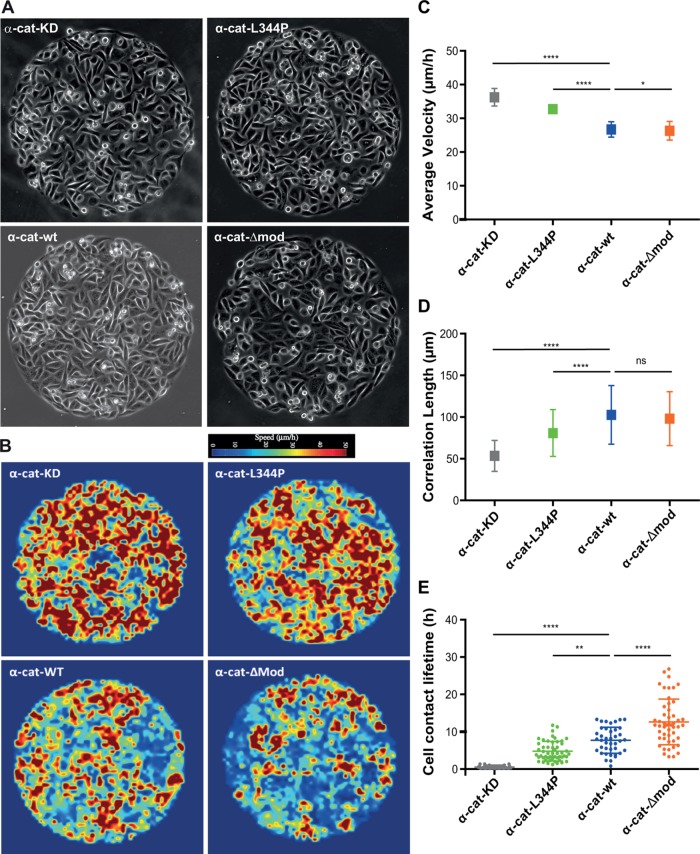
Vinculin/α-catenin association controls collective cell behavior and cell–cell contact lifetime. (A) MDCK cells silenced for α-catenin (α-cat KD), as well as cells expressing α-cat-L334P, α-cat-Δmod, or wt α-catenin (α-cat-wt), were seeded on 500-µm Ø FN patterns and phase contrast imaged for 24–36 h (still images of Supplemental Videos 1–4). The collective behavior of cell monolayers was analyzed by PIV over 6 h providing heat maps of instantaneous local velocities (B). Mean velocities (C) and correlation lengths (D) characteristic of each cell type were then extracted from these instantaneous velocity maps (mean values ± SD) out of three independent experiments; n = 360 frames analyzed per condition, derived from 10 patterns per condition coming from three independent experiments. ****, p < 0.0001; *, p < 0.1; ns, nonsignificant; one-way ANOVA test. (E) Mean lifetime of individual cell–cell contacts measured for each cell type (scatter dot plot: mean ± SD, n = 30 cell doublets for α-cat KD and α-cat-wt, and n = 51 for α-cat-L334P, α-cat-Δmod, out of ≥4 patterns derived from ≥2 independent experiments for each condition; ****, p < 0.0001; **, p < 0.01; one-way ANOVA test).

