FIGURE 2:
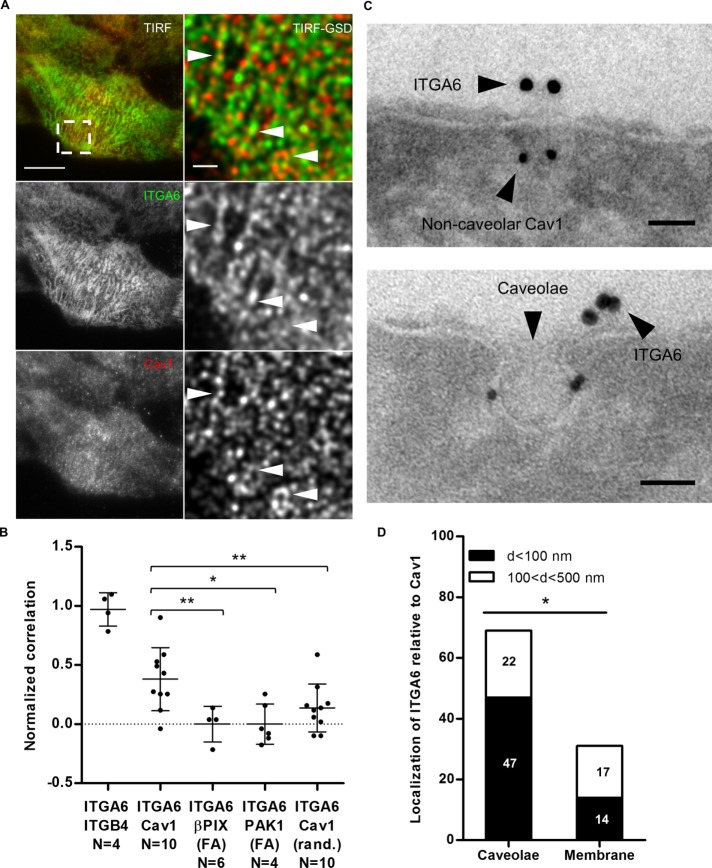
ITGA6 localizes close to caveolar and noncaveolar Cav1 at the basal membrane. (A) HaCaT cell immunostained for ITGA6 and Cav1. Left panel: TIRF image, scale bar = 10 µm; right panel: GSD-TIRF image (pixel size = 20 nm), scale bar = 1 µm. Arrowheads highlight colocalization. (B) Mean correlation of both channels measured in single GSD images for each pair of markers. Values are normalized to the mean correlation coefficient of ITGA6/ITGB4 GSD images used as positive control and compared with the correlation of ITGA6 at focal adhesions marked by βPIX or PAK1 taken as a negative control from a least four independent experiments. Mann-Whitney tests: R(ITGA6/Cav1) vs. R(ITGA6/βPIX(FA)), R(ITGA6/PAK1(FA)), or R (ITGA6/Cav1 randomized). (C) Immunoelectron micrographs of the plasma membrane of HaCaT cells after staining with antibodies against ITGA6 (15-nm gold beads) and Cav1 (10-nm gold beads). Scale bar = 50 nm. (D) Quantification of the localization of ITGA6 relative to caveolar and noncaveolar Cav1 (noted caveolae and membrane, respectively) from EM micrographs (N = 30) from three independent experiments. Fischer test: d < 100 nm vs. 100 < d < 500 nm in caveolae or at the membrane.

