FIGURE 8:
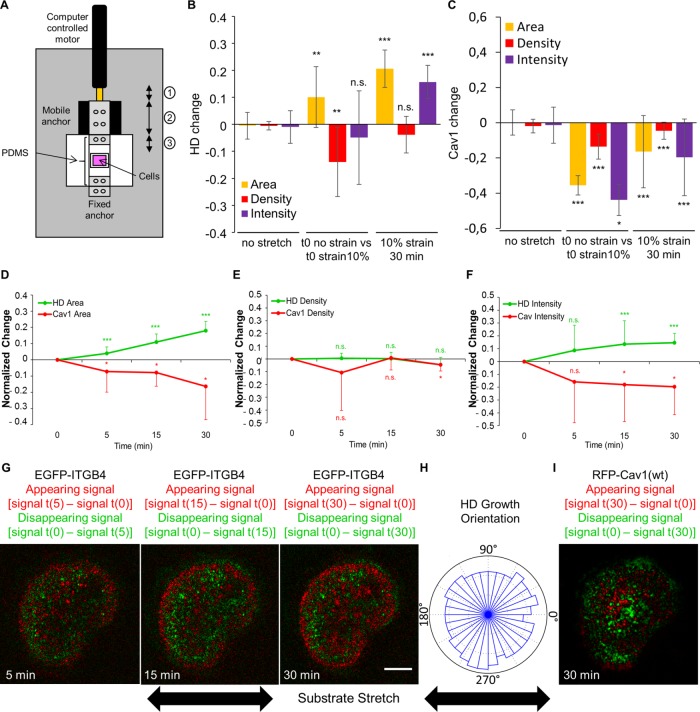
Hemidesmosomes respond to external mechanical stimuli. (A) Scheme of the custom-built stretcher used. The motor motion (1) induces the displacement of the mobile anchor (2) driving the stretching of the PDMS membrane (3). (B, C) Quantification at the basal plasma membrane of the area (yellow), density (red), and total intensity (purple) changes of (B) EGFP-ITGB4 or (C) RFP-Cav1(wt) without strain (left), before and immediately after a 10% uniaxial strain (middle), or after 30 min of a 10% uniaxial strain (right), from 3–5 independent experiments; number of cells = 20, 12, and 12. Mann-Whitney tests: (no stretch) vs. (t0 no strain vs. t0 strain 10%) or (10% strain 30 min). (D–F) Quantification of the area (D) and total intensity (E) and density (F) of HDs (green) and Cav1 (red) in cells expressing EGFP-ITGB4 and RFP-Cav1(wt) after 5, 15, and 30 min of stretch with a 10% uniaxial strain. All values are normalized to time 0. Data are from three to five independent experiments; number of cells = 12. Mann-Whitney tests: 0 vs. 5 min, 15 min, or 30 min. (G, I) Confocal images of a cell expressing EGFP-ITGB4 (G) and RFP-Cav1 (I) under a 10% uniaxial strain after 5, 15, and 30 min. The green channel shows what disappears by subtracting from the signal in the first frame t(0) the signal at time t (5, 15, or 30 min): signal t(0) – signal t(x); the red channel shows what appears by subtracting from the signal at time t (5, 15, or 30 min) the signal in the first frame t(0): signal t(x) – signal t(0). Scale bar = 10 µm. (H) Quantification of the orientation of HD growth after 30 min of strain. Data are from three to five independent experiments; number of cells = 12. Images are related to Supplemental Video 4.

