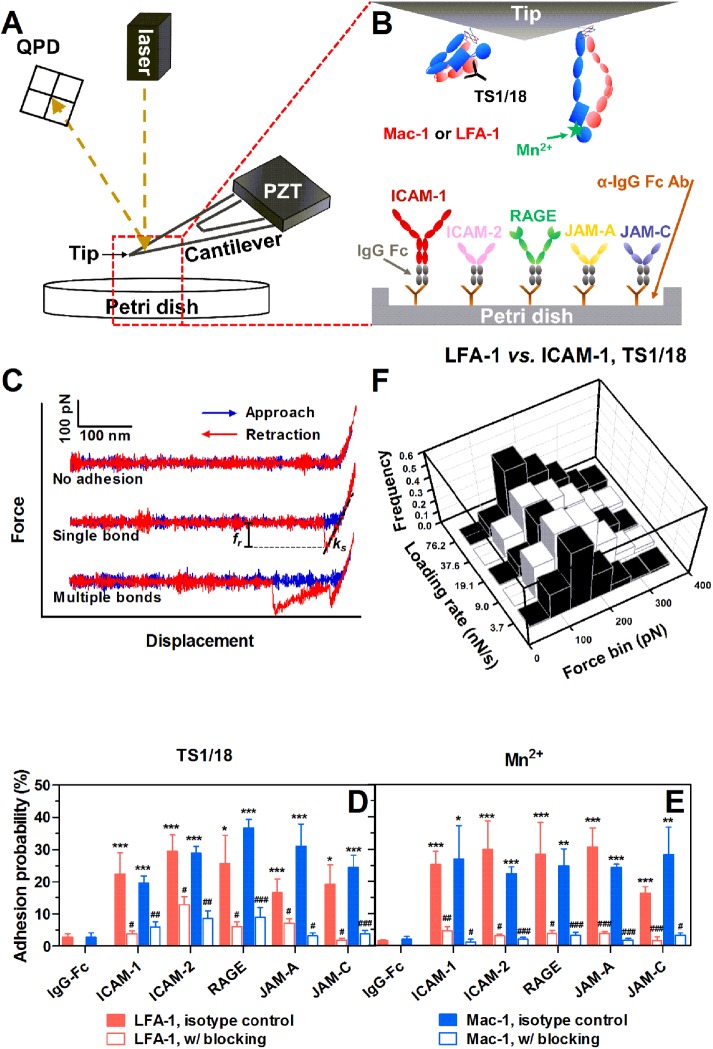
FIGURE 1:
AFM tests for β2 integrin-ligand bonds. (A) Schematic of AFM setup. A PZT was used to drive the movement of an AFM cantilever. Adhesion events and forced bond rupture signals were collected from a QPD that measures the deflection of a laser beam reflected on the cantilever. (B) AFM functionalization. Recombinant human LFA-1s or Mac-1s were adsorbed onto the AFM tip and treated with TS1/18 mAbs or Mn2+ to obtain low- or high-affinity conformation integrins, respectively. Soluble ligand (ICAM-1, ICAM-2, RAGE, JAM-A, or JAM-C)–IgG Fc chimeras were coated via anti-IgG Fc secondary antibodies precoated on a Petri dish. (C) Typical force–displacement curves. An LFA-1– or Mac-1–captured AFM tip was driven to approach to (from left to right, blue lines), contact, and retract from (from right to left, red lines) a ligand-coated Petri dish. Adhesion was visualized from cantilever deflection and rupture force (fr) was measured from the force–displacement curve (middle and lower trajectories). ks is the system spring constant derived from the slope of the adhesive event. (D, E) Binding specificity. The LFA-1– or Mac-1–captured tip was pretreated with isotype control (closed bars) or LFA-1/Mac-1 blocking (open bars) mAbs. Adhesion probabilities were measured between the tip and various ligand-coated Petri dishes with TS1/18 (D) or Mn2+ (E). All measurements were acquired at a cantilever approach and retraction velocity of 1 μm/s, a contact duration of 50 ms, and a compression force of 200 pN. An anti-IgG Fc secondary antibody–coated substrate was used as a negative control. Data are presented as the mean ± SEM of three or four tips in each case. Significant differences are indicated by *, p < 0.05; **, p < 0.01; ***, p < 0.001 between each ligand and negative control, by #, p < 0.05; ##, p < 0.01; ###, p < 0.001 between each blocking group and isotype control, or by $, p < 0.05; $$, p < 0.01; $$$, p < 0.001 among various ligands. (F) Typical rupture force distributions for the interactions between LFA-1 and ICAM-1 with TS1/18 at the indicated loading rates. Total 251–394 single-bond rupture force data at each loading rate were collected and analyzed using a force bin of 50 pN.

