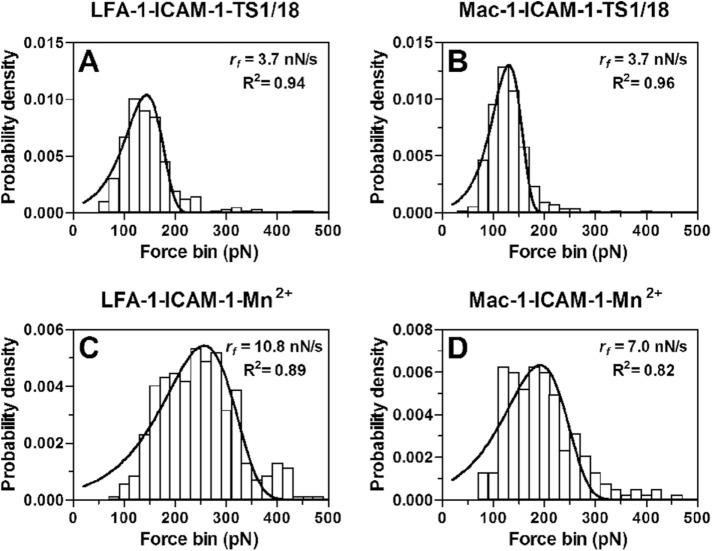
FIGURE 2:
Typical rupture force distributions (histograms) of LFA-1–ICAM-1 (A, C) or Mac-1–ICAM-1 (B, D) bonds prebound with TS1/18 mAbs (A, B) or activated with Mn2+ (C, D) at the indicated loading rates. Total 109–474 single-bond rupture force data at each loading rate were collected and analyzed using a force bin of 20 pN. The fitted curves (lines) were obtained using Eq. 2 (see AFM assay).

