FIGURE 3:
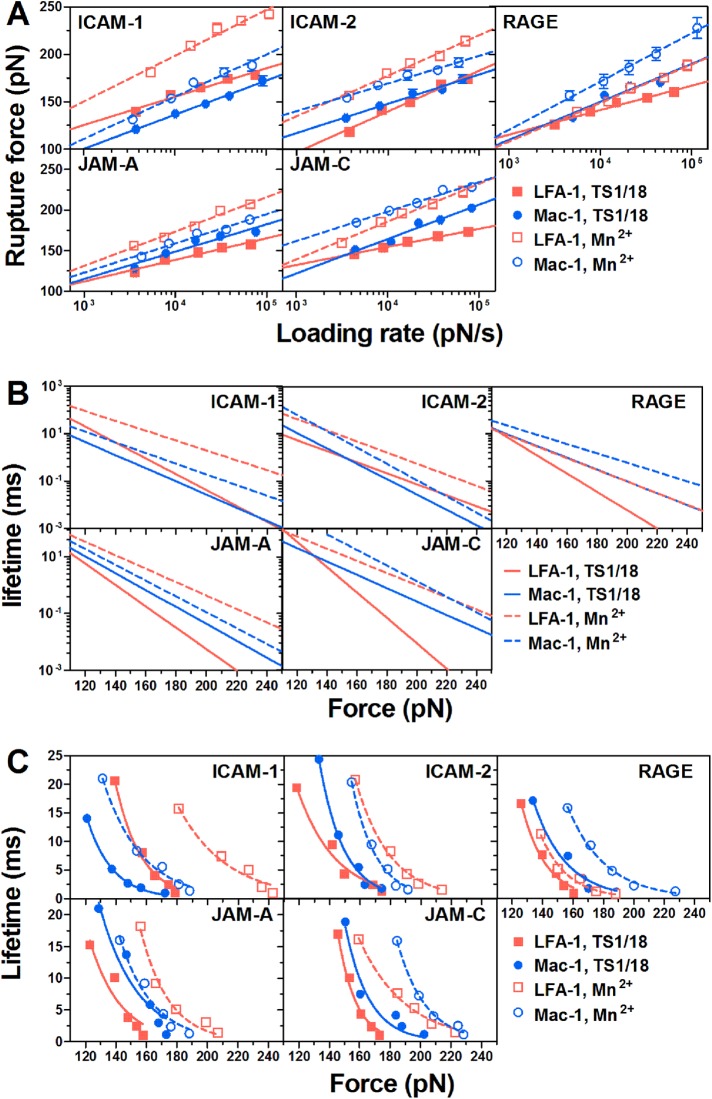
Rupture force and lifetime of LFA-1/Mac-1–ligand bonds. (A) Dependence of rupture force on loading rate. Data are presented as the mean ± SEM of 109–474 force data at each loading rate and fitted by Eq. 3 (lines; see AFM assay). (B) Bond lifetime as a function of applied force (lines), obtained using a Bell model (Eq. 1) and the parameters koff0 and a obtained from Figure 2A (Supplemental Table 3). (C) Lifetime as a function of applied force (points), obtained from the variance of rupture force distribution using Eq. 4. The fitted curves (lines) were obtained using Eq. 1. Measurements were acquired between LFA-1 (red squares and lines) or Mac-1 (blue circles and lines) and the indicated ligand with TS1/18 (closed points, solid lines) or Mn2+ (open points, dashed lines).

