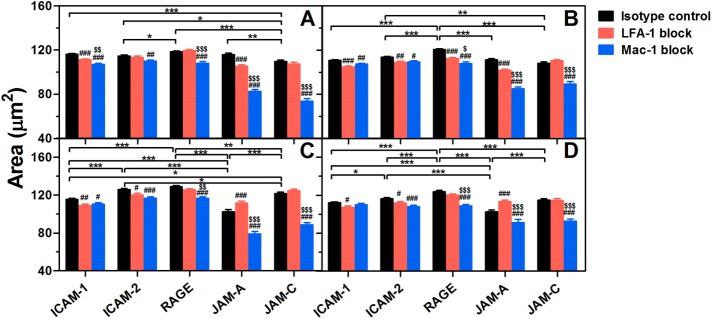
FIGURE 5:
Shear-induced spreading of adherent PMNs on distinct ligands. Spreading area of resting (A, B) or fMLF-activated (C, D) PMNs pretreated with isotype control (black bars) or LFA-1 (red bars)/Mac-1 (blue bars) blocking mAbs on various ligands after being exposed to a shear flow of 1 dyn/cm2 (A, C) or 10 dyn/cm2 (B, D) for 10 min. Data are presented as the mean ± SEM from a total of 178–2003 cells in 50–90 FOVs of five to nine independent experiments and analyzed with two-way ANOVA (followed by a Holm–Sidak test). Significant differences are indicated by *, p < 0.05; **, p < 0.01; ***, p < 0.001 among various ligands, by #, p < 0.05; ##, p < 0.01; ###, p < 0.001 between each blocking group and isotype control, or by $, p < 0.05; $$, p < 0.01; $$$, p < 0.001 between LFA-1– and Mac-1–blocking groups.

