FIGURE 5:
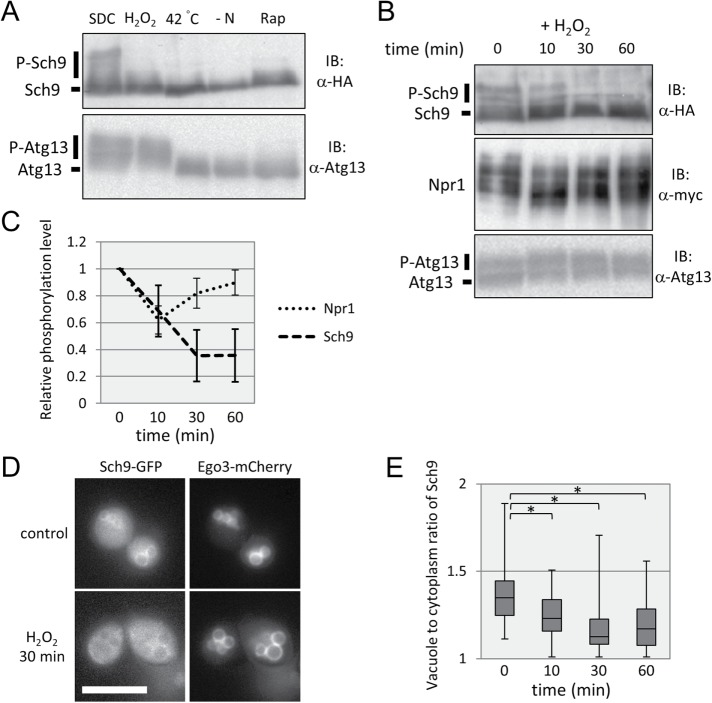
Oxidative stress alters Sch9 localization and inhibits TORC1-Sch9 signaling. (A) Western blot analysis of the C-terminal fragment of Sch9-5HA (yet515) and Atg13 (yet562). Cells in mid–log phase were treated with SDC (control), SDC + 2 mM H2O2 (oxidative stress), SDC at 42°C (heat stress), SD−N (nitrogen depletion), or SDC + 200 ng/ml rapamycin (TORC1 inhibitor) for 30 min, and the lysates were subjected to Western blotting. (B) Western blot analysis of the C-terminal fragment of Sch9-5HA (yet515), Npr1-13myc (yet610), and Atg13 (yet562). Cells in mid–log phase were treated with 2 mM H2O2 in SDC, and the lysates were subjected to Western blotting at each time point. (C) Quantification of the band shift data of Npr1 and Sch9 from B (Npr1: n = 5, Sch9: n = 3). Error bars represent 95% confidence intervals. (D) Representative images of control or oxidative stress-induced (treated with 2 mM H2O2 for 30 min) cells expressing Sch9-2GFP and Ego3-3mCherry (yet765) during mid–log phase in SDC medium. Ego3-3mCherry was used as a vacuolar marker. Scale bar = 5 µm. (E) Quantification of the ratio of Sch9 fluorescence intensity of vacuolar membranes to that of the cytoplasm. Related to D. A ratio of 1.00 means no enrichment on vacuolar membranes. To calculate the p value, we applied the Brunner-Munzel test. *p < 0.005.

