FIGURE 2:
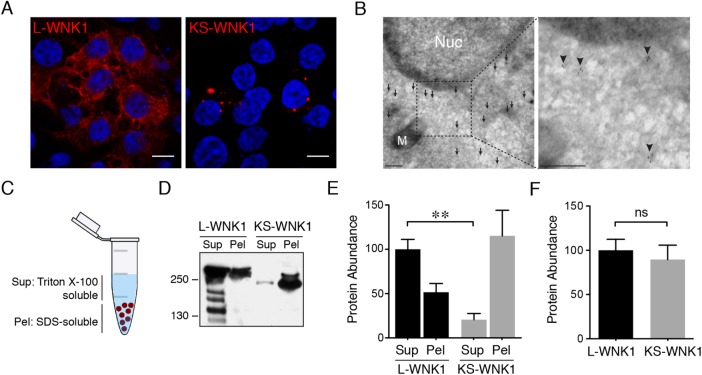
In contrast to L-WNK1, KS-WNK1 forms large puncta in vitro. (A) Immunofluoresence of HEK-293 cells transiently transfected with either L-WNK1-HA or KS-WNK1-HA. (n = 5 transfections; scale bar = 10 μm). (B) Immunogold electron micrographs of HEK-293 cells transiently transfected with KS-WNK1-HA, labeled with anti-HA antibody. Note the concentration of gold particles (arrows) in an electron hypodense region of the cytosol. M = mitochondria; Nuc = nucleus. Scale bar = 100 nm. (C) Supernatant/pellet (SP) assay. Cell lysates were separated into Triton-soluble and Triton-resistant, SDS–soluble fractions. (D) Immunoblots of HEK-293 cells transiently transfected with either L-WNK1-HA or KS-WNK1-HA, subjected to SP assay. Blots were probed with HA antibody revealing a band at ∼250 kDa, corresponding to the MW of L-WNK1 and slightly lower band for KS-WNK1. L-WNK1-HA Sup also contains several other bands, presumably degradation products. (E) Relative protein abunance of L-WNK1 vs. KS-WNK1 in the SP assay. Data were normalized to the L-WNK1 protein abundance in the Sup fraction. (n = 7 transfections; **: p = 0.0021, paired t test). (F) Comparison of the summed supernatant plus pellet protein abunance of L-WNK1 vs. KS-WNK1 in transiently transfected HEK-293 cells (n = 7 transfections; NS by unpaired t test).

