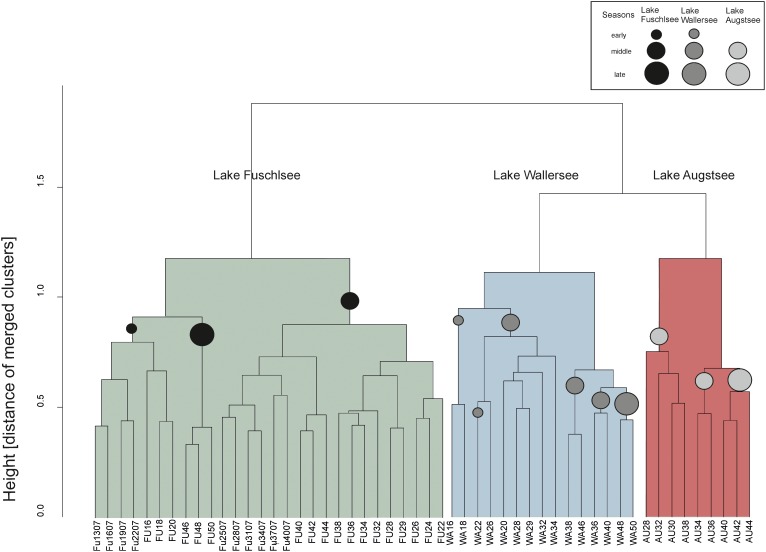
FIGURE 4.
Unconstrained dendogram of the hierarchical clustering of the Bray–Curtis dissimilarity matrices of the eukaryotic dataset. The samples on the x-axis are labeled according to the lake of origin (WA, Wallersee, AU, Augstsee, FU, Fuschlsee) and sampling week. At the y-axis, the height corresponds to the distance of merged clusters based on the variance criterion of the WARD.D2 cluster method. Circles in the dendrogram indicate samples belonging to the same “season.”

