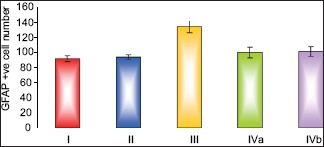
Histogram 2.

Comparison between the different groups as regard mean ± standard deviation of the number of glial fibrillary acidic protein +ve cells

Comparison between the different groups as regard mean ± standard deviation of the number of glial fibrillary acidic protein +ve cells