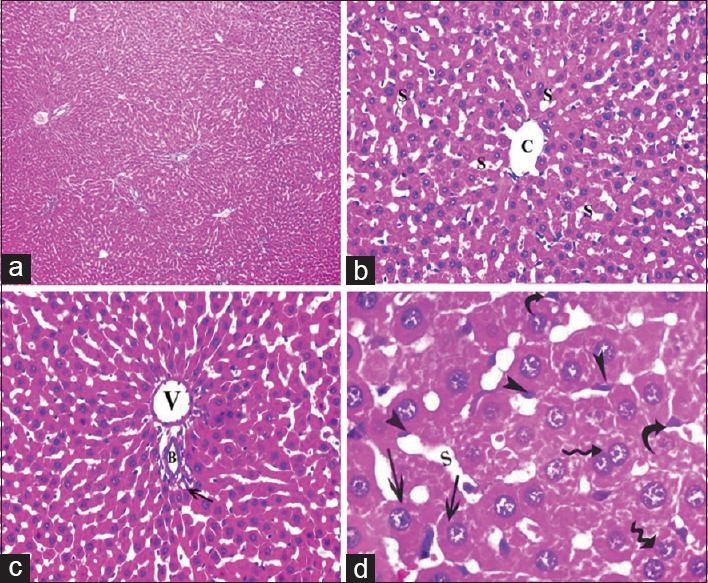
Figure 2.

Photomicrographs of liver sections of control group showing: (a) Normal liver architecture. (b) A classic hepatic lobule-containing central vein (c) and radiating cords of hepatocytes with blood sinusoids (s) in between. (c) Portal tract at the periphery of a classic hepatic lobule revealing a portal venule (v), a hepatic arteriole (arrow) and a bile ductule (b). (d) Polyhedral hepatocytes with large, rounded vesicular nuclei (arrow) and prominent nucleoli, some binucleated cells are also present (waved arrow), blood sinusoids (s) are present in between the cords of hepatocytes and are lined by flattened endothelial cells (arrowhead) and Kupffer cells (curved arrow) (a: H and E, ×100, b and c: H and E, ×400, d: H and E, ×1000)
