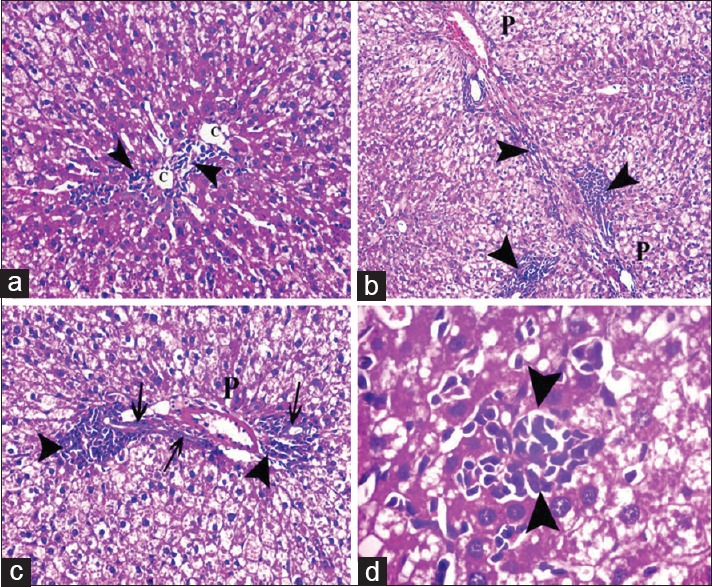
Figure 4.

Photomicrographs of liver sections of Group III showing cellular infiltrations (arrowhead). (a) Infiltrations around and in between central veins (C). (b and c) Infiltrations around and in between the components of portal tract (P) with proliferation of bile ductules (arrow). (d) Infiltrations between the hepatocytes. Notice most of the hepatocytes are vacuolated (a and c: H and E, ×400, b: H and E, ×200, d: H and E, ×1000)
