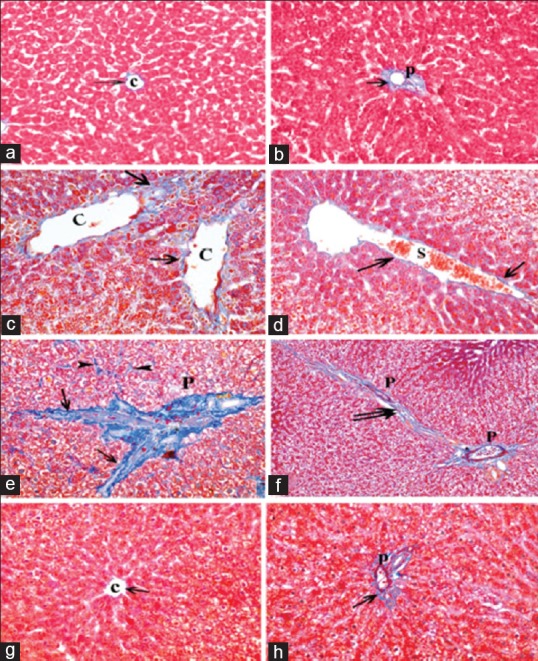
Figure 7.

Photomicrographs of liver sections showing collagen fibers (arrow) around the central vein (C) and the components of a portal tract (P). (a and b) showing fine collagen in control group. (c-f) Apparent increase in the amount of collagen fibers around dilated central veins, components of a portal tract, dilated congested blood sinusoids (S), and extending in-between the lobules (double arrow) as well as between the cords of hepatocytes (arrowhead). (g and h) Showing fine collagen fibers (arrow) around the central vein and portal tract in protective group (Mallory's trichrome a-h: ×400, f: ×200)
